
“Prepare for the unknown by studying how others in the past have coped with the unforeseeable and the unpredictable.”-George S. Patton
Jobs Update
- Initial jobless claims seasonally adjusted for the week ending December 27, 2025 came in at 199,000, versus the adjusted number of 215,000 people from the week prior, down 16,000 people week over week.
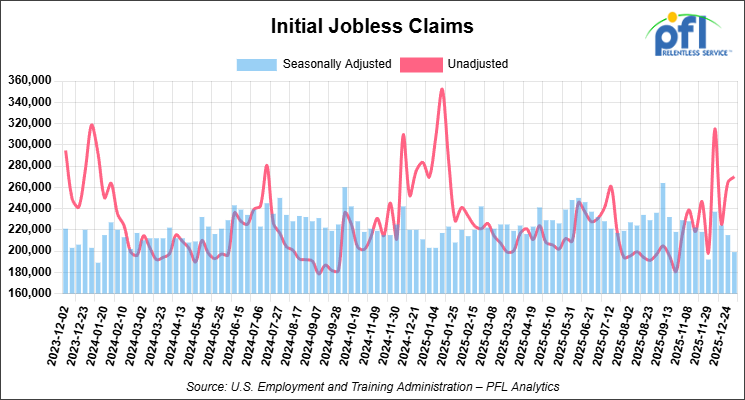
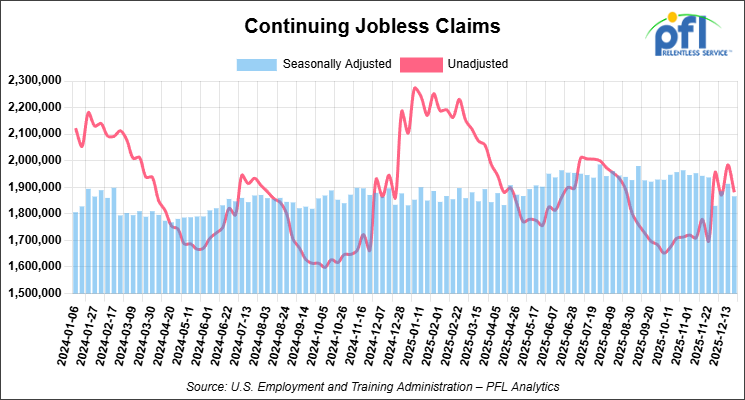
- Continuing jobless claims came in at 1,866,000, versus the adjusted number of 1,913,000 people from the week prior, down 47,000 week-over-week.
Stocks closed mixed on Friday of last week, but lower week-over-week
The DOW closed higher on Friday of last week, up 319.10 points (0.66%), closing out the week at 48,382.39, down -328.58 points week-over-week. The S&P 500 closed higher on Friday of last week, up 12.97 points (0.19%), and closed out the week at 6,858.47, down -71.47 points week-over-week. The NASDAQ closed lower on Friday of last week, down -6.36 points (-0.03%), and closed out the week at 23,235.63, down -357.47 points week-over-week.
In overnight trading, DOW futures traded higher and are expected to open at 48,641 this morning, up 25 points from Friday’s close.
Crude oil closed lower on Friday of last week, but higher week-over-week
West Texas Intermediate (WTI) crude closed down -0.10 per barrel, to close at $57.32 on Friday of last week, but up $0.58 week-over-week. Brent crude closed down -0.10 per barrel, to close at $60.75, but up $0.11 week-over-week.
One Exchange WCS (Western Canadian Select) for February delivery settled on Friday of last week at US$13.10 below the WTI-CMA (West Texas Intermediate – Calendar Month Average). The implied value was US$44.22 per barrel.
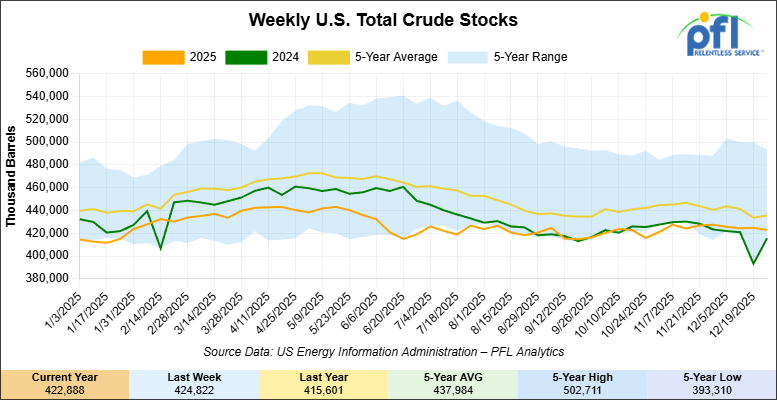
U.S. commercial crude oil inventories (excluding those in the Strategic Petroleum Reserve) decreased by 1.9 million barrels week-over-week. At 422.9 million barrels, U.S. crude oil inventories are 3% below the five-year average for this time of year.
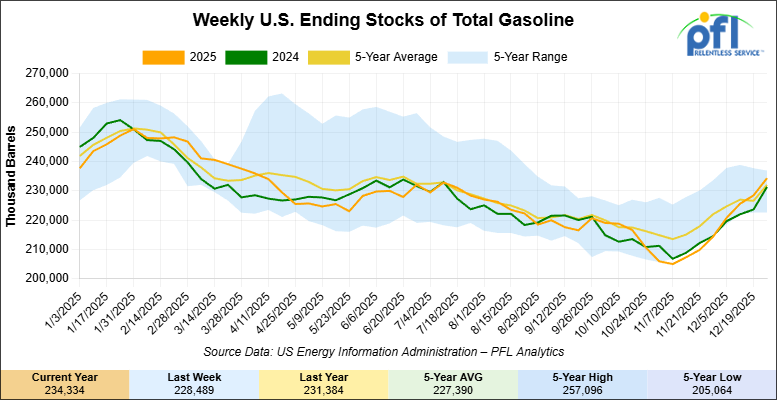
Total motor gasoline inventories increased by 5.8 million barrels week-over-week and are 2% above the five-year average for this time of year.
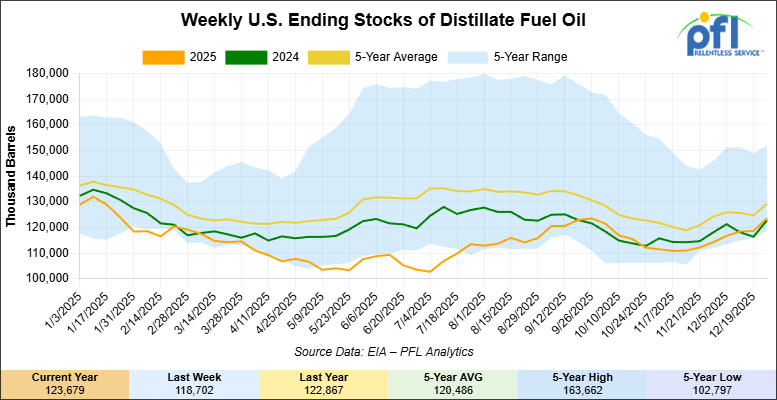
Distillate fuel inventories increased by 5 million barrels week-over-week and are 4% below the five-year average for this time of year.
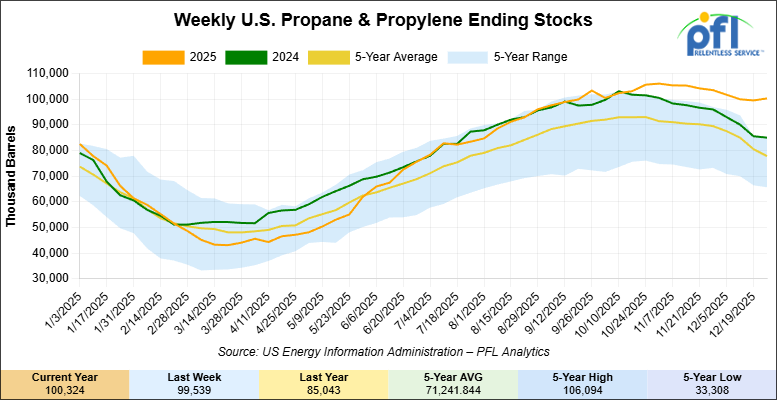
Propane/propylene inventories increased 800,000 thousand barrels week-over-week and are 27% above the five-year average for this time of year.
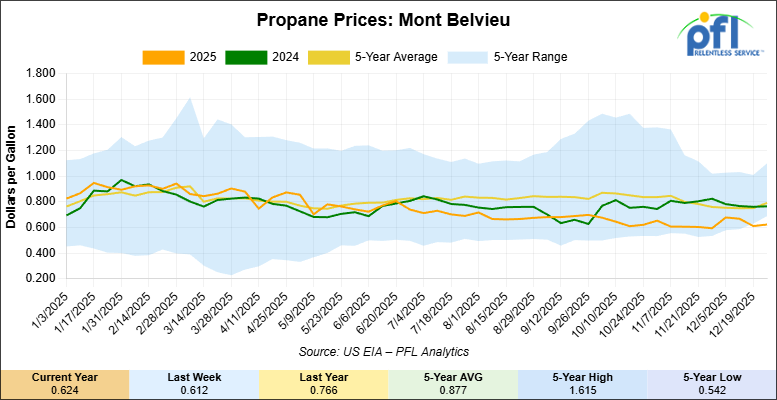
Propane prices closed at 62.4 cents per gallon on Friday of last week, up 1.2 cents per gallon week-over-week, but down 14.2 cents year-over-year.
Overall, total commercial petroleum inventories increased by 10.2 million barrels week-over-week, during the week ending December 26, 2025.
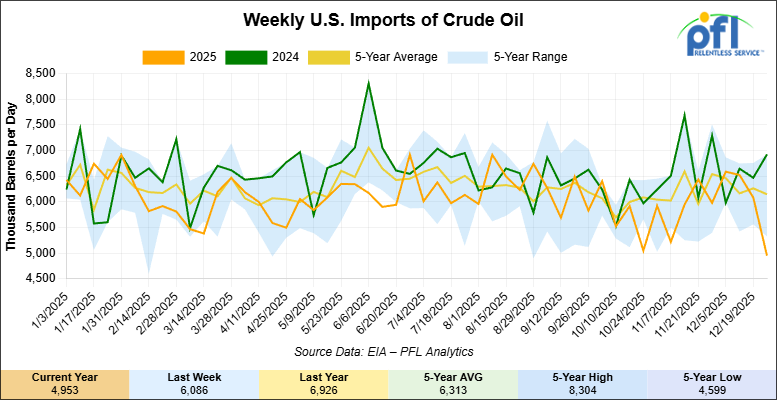
U.S. crude oil imports averaged 5 million barrels per day during the week ending December 26, 2025, a decrease of 1.1 million barrels per day week-over-week. Over the past four weeks, crude oil imports averaged 6 million barrels per day, 7.2% less than the same four-week period last year. Total motor gasoline imports (including both finished gasoline and gasoline blending components) averaged 525,000 barrels per day, and distillate fuel imports averaged 283,000 barrels per day during the week ending December 26, 2025.
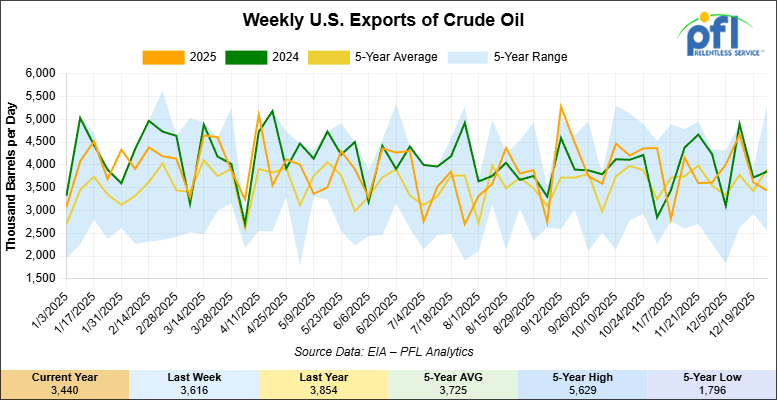
U.S. crude oil exports averaged 3.44 million barrels per day during the week ending December 26, 2025, a decrease of 176,000 barrels per day week-over-week. Over the past four weeks, crude oil exports averaged 3.932 million barrels per day.
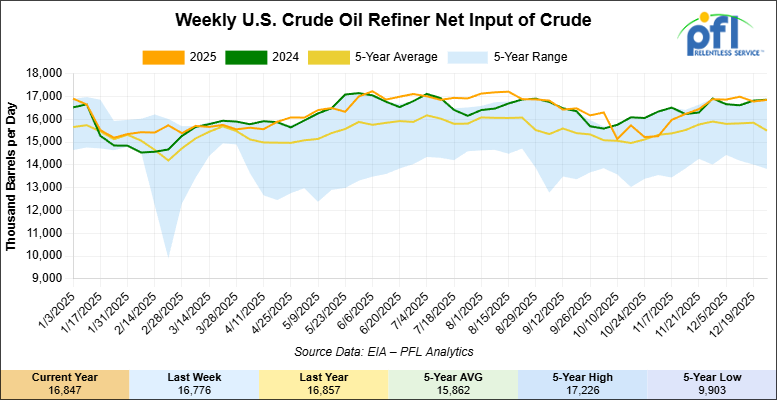
U.S. crude oil refinery inputs averaged 16.8 million barrels per day during the week ending December 26, 2025, which was 71,000 barrels per day more week-over-week.
WTI futures are poised to open at $57.59, up $0.27 from Friday’s close.
North American Rail Traffic
Week Ending December 24, 2025:
Total North American weekly rail volumes were down (-6.27%) in week 52, compared with the same week last year. Total Carloads for the week ending December 24, 2025 were 309,912, down (-6.38%) compared with the same week in 2024, while weekly Intermodal volume was 337,363, down (-6.17%) year over year. 9 of the AAR’s 11 major traffic categories posted year-over-year decreases. The largest decrease came from Forest Products (-19.81%), while the largest increase was Other (+1.15%).
In the East, CSX’s total volumes were down (-3.40%), with the largest decrease coming from Grain (-22.14%), while the largest increase came from Other (+9.16%). NS’s total volumes were down (-5.34%), with the largest increase coming from Petroleum & Petroleum Products (+5.68%), while the largest decrease came from Nonmetallic Minerals (-15.32%).
In the West, BNSF’s total volumes were down (-3.39%), with the largest increase coming from Coal (+61.83%), while the largest decrease came from Chemicals (-21.19%). UP’s total volumes were down (-8.01%), with the largest increase coming from Grain (+9.26%), while the largest decrease came from Coal (-36.06%).
In Canada, CN’s total volumes were down (-4.90%), with the largest increase coming from Other (+73.46%), while the largest decrease came from Intermodal Units (-15.57%). CPKCS’s total volumes were down (-26.43%), with the largest increase coming from Coal (+17.73%), while the largest decrease came from Forest Products (-66.75%).
Source Data: AAR – PFL Analytics
North American Rig Count Summary
Rig Count
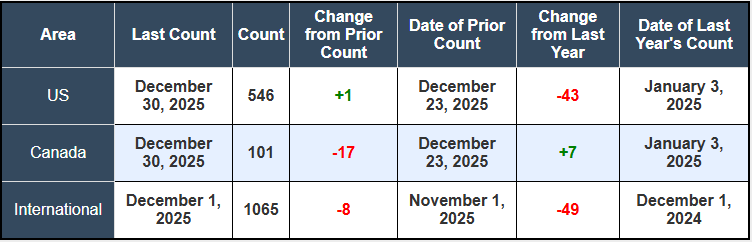
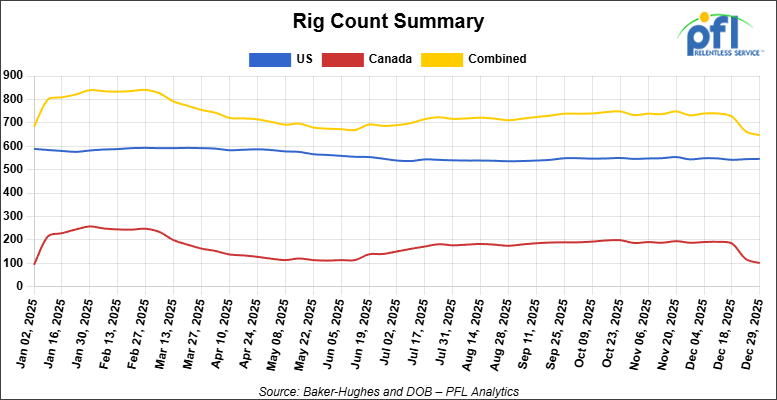
North American rig count was down by -16 rigs week-over-week. The U.S. rig count was up by +1 rig week-over-week, and down by -43 rigs year-over-year. The U.S. currently has 546 active rigs. Canada’s rig count was down by -17 rigs week-over-week but up by +7 rigs year-over-year. Canada currently has 101 active rigs. Overall, year-over-year we are down by -36 rigs collectively.
We are watching a few things out there for you:
We are watching Venezuela
In a stunning overnight operation that shocked global markets and reshaped the Western Hemisphere’s political landscape, U.S. Special Forces conducted an incursion into Venezuela early Saturday morning, January 3, capturing President Nicolás Maduro and his wife Cilia Flores at their residence within Fort Tiuna military installation in Caracas and flying them out of the country to face narco-terrorism charges in New York federal court.
President Trump announced the capture on social media around 4:30 a.m. ET Saturday, declaring that U.S. forces had successfully extracted Maduro after what he characterized as an extraordinary display of military precision. Speaking to Fox News later Saturday, Trump said he had watched the operation in real time and stated he had “never seen anything like it,” describing how U.S. commandos breached reinforced steel doors at the Fort Tiuna compound “in a matter of seconds.” The operation involved at least seven major airstrikes across Caracas and surrounding regions, with low-flying aircraft visible to residents around 2 a.m. local time. Trump confirmed that some U.S. forces sustained injuries, but reported no deaths.
For tank car operators and North American crude markets, the long-term market implications could be substantial. Venezuela holds the world’s largest proven crude oil reserves, but has seen production and exports collapse under Maduro’s mismanagement and escalating U.S. sanctions enforcement, falling from roughly 3 million barrels per day in 2012 to approximately 1.1 million bpd by late 2025. The Trump Administration stepped up tanker sanctions enforcement in December, seizing the crude tanker Merlin on December 10 and declaring an effective blockade on Venezuelan exports on December 16, cutting deliveries roughly in half from November levels.
World Reserves
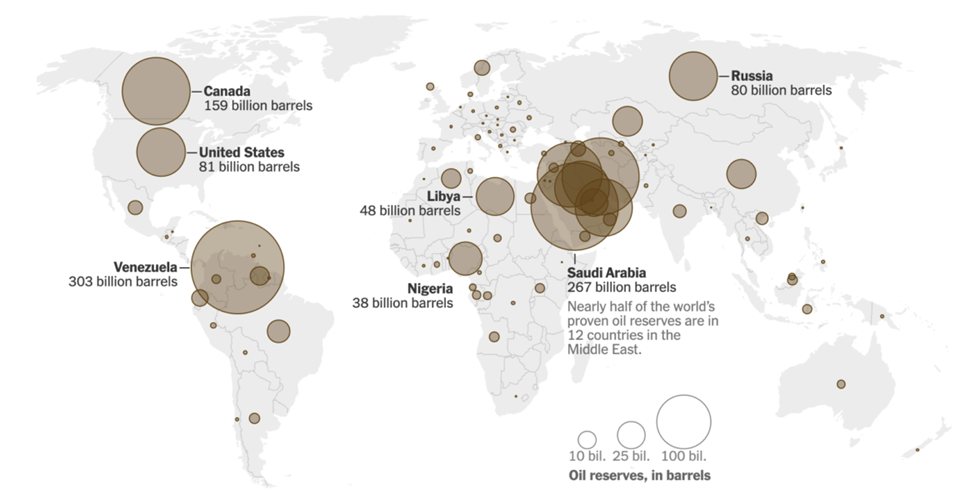
Source: The New York Times Oil and Gas Journal – PFL Analytics
The immediate aftermath of Maduro’s capture shows a Venezuelan government apparatus in complete disarray. State oil company PDVSA’s command structure is unclear, and the country faces potential refugee flows as border security collapses. In the short term, Venezuelan crude exports will likely collapse further as tanker operators face legal and operational uncertainty and as potential transitional authorities assess the status of the country’s oil infrastructure.
This tightens the global heavy sour market sharply over the next 60-90 days, creating concrete upside for North American crude-by-rail economics. Canadian heavy crude rail rates from Alberta to the U.S. Gulf Coast are approximately $15.00 per barrel. At Hardisty, Alberta, Western Canadian Select’s discount to the CMA Nymex widened to $13.05 per barrel – 70 cents wider than a month earlier—reflecting robust Canadian production meeting pipeline constraints and rail optionality. With Venezuelan medium sour supplies tightening and U.S. Gulf Coast domestic sour production surging (spot trading of Southern Green Canyon crude hit a record 300,000 b/d in December 2025, the largest monthly volume since the assessment launched in 2006), refiners dependent on heavy crude have limited alternatives beyond Canadian heavy in the short term.
U.S. Gulf Coast refiners who have relied on Venezuelan heavy crude will be forced to source alternatives over the next 60-90 days—predominantly Canadian heavy, Mexican Maya, or Middle Eastern crudes. This creates incremental demand for North American rail movements and potential utilization support for existing crude tank car fleets. The economic case for Canadian crude-by-rail strengthens materially when pipeline capacity to the Gulf Coast is constrained and Canadian heavy discounts widen relative to delivered alternatives.
The medium-term outcomes depend entirely on whether a stable transitional government emerges and whether the Trump administration moves toward sanctions relief. Venezuelan opposition leader Edmundo González, recognized by the U.S. as the legitimate election winner, could theoretically form a transitional government relatively quickly, although this was dismissed by Trump over the weekend saying she does not have the respect of the people. If sanctions are lifted over the coming months and foreign investment resumes, Venezuelan production could ramp toward 1.5-2.0 million bpd over in short order as Chevron, international NOCs, and service companies return. That scenario would add substantial seaborne heavy crude supply back to global markets, eventually softening WCS differentials and reducing Canadian crude-by-rail shipments.
An additional complicating factor: the shift in Canadian crude flows toward Asia. Approximately 66%of heavy Canadian crude exports from the Trans Mountain pipeline system were destined to Asia-Pacific year-to-date November 2025, up from a 60:40 split in the second half of 2024. This shift accelerated following West Coast refinery closures—Phillips 66 shuttered its 139,000 b/d Los Angeles refinery on October 16, and Valero is planning to close its 145,000 b/d Benicia refinery near San Francisco by April 2026. Those three refineries represented 23% of California’s refinery capacity and combined took 30,000 b/d of Cold Lake crude in the first half of 2025. For PFL’s customers, the takeaway is that short-term Venezuelan supply tightness supports crude-by-rail margins from Western Canada, but the structural shift of Canadian crude toward Asian tanker movements could limit the upside of those economics if Asia-bound exports continue growing at the expense of U.S. Gulf Coast rail movements.
For now, Venezuelan regime change has created a near-term tightening in heavy crude supply that benefits crude-by-rail economics from Western Canada, while longer-term outcomes remain dependent on how quickly a stable transitional government consolidates control and whether sanctions are normalized. The next 30 days will be critical in determining whether continued Venezuelan supply collapse or rapid normalization becomes the base case for 2026 energy markets and rail transportation demand. Stay tuned to PFL, we are watching this one closely,
We are watching Petroleum Carloads
The four-week rolling average of petroleum carloads carried on the six largest North American railroads fell to 29,082 from 29,740, which was a decrease of +658 rail cars week-over-week. Canadian volumes were lower. CPKC’s shipments were lower by -18.0% week-over-week, CN’s volumes were lower by -22..0% week-over-week. U.S. shipments were mixed. The BNSF had the largest percentage increase and was up by +1.0%. The CSX had the largest percentage decrease and was down by -17%.
We were watching a Train Derailment in Kentucky
In case you missed it, a CSX freight train derailed on December 29th in rural Todd County, Kentucky and sent 31 cars off the tracks near the Tennessee border, with at least one tank car carrying molten sulfur that leaked and sparked a fire—triggering emergency response measures and temporary evacuation orders that remained in effect through the weekend. The incident occurred just after 6:15 a.m. local time near Trenton, a community of approximately 350 residents located 55 miles northwest of Nashville. While no injuries were reported and air quality testing confirmed acceptable conditions after the fire was extinguished, the derailment serves as a stark reminder of hazmat transport risks and the critical importance of emergency preparedness infrastructure.
Kentucky Train Derailment
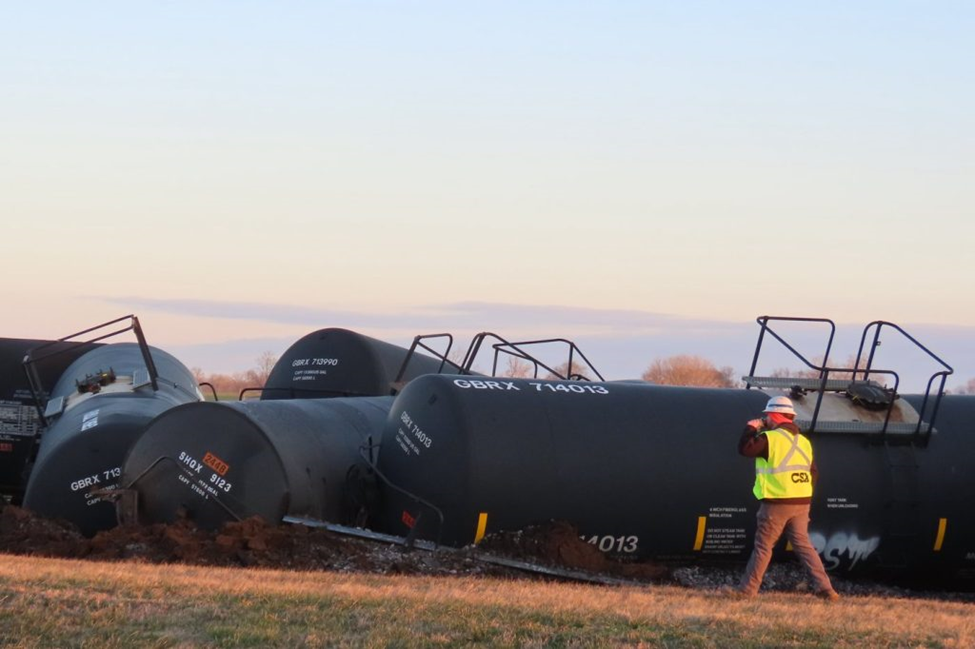
Source: WEKT via AP – PFL Analytics
We are watching the NS and the UP merger
The proposed Union Pacific–Norfolk Southern merger has officially entered the “gloves-off” phase. Following the December 19th filing of a massive seven thousand (7,000) page application, the industry’s response was swift and overwhelmingly negative. By the December 29th deadline, a “who’s who” of Class I railroads—including BNSF, CSX, CN, and CPKC—filed formal comments urging the Surface Transportation Board (STB) to reject the deal.
The opposition isn’t just complaining about competition; they are attacking the technical merits of the application itself. Rival carriers identified several “deficiencies,” claiming the filing omitted key data on truck diversion, failed to include essential appendices of the merger agreement, and provided an “incomplete” network map that glosses over overlapping lines. BNSF was particularly blunt, stating the application only “superficially grapples” with the economic risks involved.
While UP and NS filed a rebuttal on January 2nd defending their work, the STB now has the final word on whether the application is complete. For railcar owners and lessors, this creates a state of suspended animation. We are looking at a full year—likely stretching into 2027—of strategic uncertainty. Until the STB signals whether this deal is actually viable, the industry will find it difficult to optimize long-term fleet strategies against a potentially reshaped North American landscape.
We are watching Labor Peace Agreement
The Brotherhood of Locomotive Engineers and Trainmen concluded the final chapter of the 2025 freight rail bargaining cycle on December 30 when members ratified a five-year national agreement with overwhelming support—marking the last major union settlement and establishing labor stability across North American freight operations through 2030. The agreement, covering more than 12,000 BLET members at 10 major freight railroads including BNSF, Norfolk Southern, and Canadian National, delivered wage increases of 18.8 percent over the contract term, a $500 lump sum signing payment, improved vacation accrual, and critically, zero concessions or work rule changes.
The 70% ratification by voting members represents decisive support after BLET National President Mark Wallace and the union’s bargaining team conducted extensive cross-country meetings to educate members on settlement terms. Coming as the final of 12 rail unions to reach tentative agreement—the Brotherhood held out longest for optimal positioning—the BLET settlement provided the closing piece to labor peace that had seemed threatened just months earlier. The wage and benefits package establishes predictable labor cost structures for the next five years, while removing a significant source of industry uncertainty as 2026 opens.
For PFL’s customer base and the broader railcar operating ecosystem, the BLET settlement removes what the industry had characterized as a major Q1 2026 risk. As one industry observer noted, “avoiding disruption is often as important as adding capacity” in rail’s constrained operating environment. The 2022 labor crisis, when a handful of congressional hours stood between the nation and an economically catastrophic rail strike, demonstrated how fragile service reliability becomes under labor uncertainty. This contract closes that file through 2030. The absence of work rule changes is particularly significant for operational efficiency—it preserves the current framework for scheduling, productivity, and network management that railroads have grown accustomed to. Benefits begin rolling out over the next 60 days, providing union members with immediate improvements while allowing railroads to budget labor costs with confidence.
However, the agreement should not be confused with comprehensive labor resolution. Underlying challenges remain: hiring, retention, fatigue management, and attendance policies continue to create long-term tension between crew availability and network efficiency. This agreement “buys time, but it doesn’t eliminate the underlying tension” between competing operational imperatives. For Q1 2026 specifically, however, the contract removes the wildcard risk of labor disruption and allows networks to focus on execution rather than managing contract uncertainty. That clarity is valuable as winter operations enter their most operationally complex period.
PFL is Watching Rail Car Manufacturing
As we enter 2026, the North American railcar market is defined by a bizarre split personality. We are seeing exceptional strength in leasing and secondary markets, yet anemic demand for new builds.
On the leasing side, it is a landlord’s market. Operating lessors are reporting renewal rates approximately 25% higher than expiring contracts, with fleet utilization sitting at a near-perfect 98.9%. Tank car rates are a prime example: a full-serve DOT-117 can now command One Thousand One Hundred and Twenty-Five Dollars ($1,125.00) per month.
However, the manufacturing side tells a much darker story:
· Anemic Orders: Third-quarter 2025 orders dropped to just 3,071 units – a 25% decline from an already weak previous quarter.
· Thin Backlogs: The industry backlog has shriveled to 25,687 units. At current delivery rates, that is less than a year’s worth of production visibility.
· The “Replacement” Trap: Forecasters suggest we aren’t in a typical cycle, but rather a “post-COVID normalization” where builds hover around 40,516 units annually – well below historical averages.
Why the disconnect? It’s a perfect storm of uncertainty. High steel and labor costs have pushed new car prices to uncomfortable levels, while persistent tariff concerns make a 30 to 50 year asset feel like a risky bet.
For PFL customers, this is a double-edged sword. While lead times for new equipment have compressed significantly because manufacturing shops are under-utilized, the broader manufacturing slump is a warning light. It suggests the rest of the industry remains deeply skeptical about future freight demand and commodity flows. Please call PFL to discuss further, or to troubleshoot your fleet requirements. We look forward to building a great 2026 together.
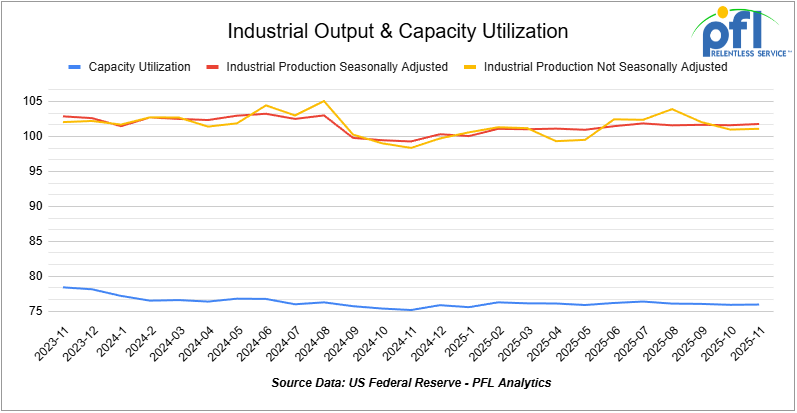
We are watching Key Economic Indicators
Industrial Output & Capacity Utilization
Manufacturing accounts for roughly 75% of total industrial output. In November 2025, manufacturing output was flat m/m, following a decline in October, and is +1.9% y/y. Total capacity utilization was 76.0%, up slightly from 75.9% (still about 3.6 pp below its long-run average). Manufacturing capacity utilization was 75.4%, essentially unchanged, still pointing to persistent slack even as headline output shows modest improvement.
Lease Bids
- 30-50, 6000cf Steel Hopper located off of CSX or NS in East. For use in petcoke service. Period: 5 Years.
- 10, 2500CF Open Top Hopper located off of UP or BN in Texas. For use in aggregate service. Period: 5 years. Need Rapid Discharge Doors.
- 50, 23.5-25.5 DOT111 Tank located off of Any Class 1 in USA. For use in Asphalt service. Period: 5 years.
- 100, 21.9K 117J Tank located off of All Class 1s in Midwest. For use in CO2 service. Period: 6 months.
- 30-50, 30K 117J Tank located off of NS or CSX in Northeast. For use in C5 service. Period: 1 year.
- 30, 30K 117J Tank located off of UP in Harlingen, TX. For use in Ethanol service. Period: 1 Year.
- 60, 33K 340W Tank located off of BNSF in UT/AZ. For use in Propane service. Period: Trip Lease.
Sales Bids
- 28, 3400CF Hopper Covered located off of UP BN in Texas. For use in Cement service.Cement Gates needed.
- 20, 17K Tank DOT111 located off of various class 1s in various locations. For use in corn syrup service.
- 120, Various Gondola Open-Top Aluminum Rotary located off of various class 1s in various locations. For use in Sulphur service.Built 2004 or later.
- 30, 29K Tank DOT111 located off of various class 1s in Chicago. For use in Veg Oil service.
Lease Offers
- 100, 30K CPC1232 Tanks located off of UP or BN in Texas. Last used in Diesel.
- 100, 30K DOT117J Tanks located off of UP or BN in Texas. Last used in Gasoline.
- 100, 29K DOT117J Tanks located off of UP or BN in Texas. Last used in Gasoline. Coiled and Insulated.
- 36, 6351 Covered Hopper located off of CN in Wisconsin. Last used in Grain. through 2/27.
- 29, 6580 Covered Hopper located off of CN in Wisconsin. Last used in Grain. through 2/26.
- 18, 6580 Covered Hopper located off of CN in Wisconsin. Last used in Grain. through 2/27.
- 9, 5400 Covered Hopper located off of CN in Wisconsin. Last used in Grain. through 2/27.
- 21, 6351 Covered Hopper located off of CN in Wisconsin. Last used in DDG. Available until February 2027.
- 29, 6500 Covered Hopper located off of CN in Wisconsin. Last used in DDG. Available until February 2027.
- 50, 5380 Covered Hopper located off of UP or BN in Houston. Last used in Fertilizer. Cars are currently clean. Available until February.
- 50, 20K DOT117J Tank located off of All Class 1s in Moving. Last used in Styrene.
- 29, 25.5K DOT117J Tank located off of UP or BN in Texas. Cars are currently clean. Cars are currently clean.
- 90, 30K DOT117J Tank located off of UP or BN in Corpus Christie. Last used in Diesel.
Sales Offers
- 21, 50′ Boxcar Plate Cs located off of various class 1s in NM. End of Life.
- 3, 50′ Boxcar Plate Cs located off of various class 1s in multiple locations. End of Life.
- 27, 50′ Boxcar Plate Cs located off of various class 1s in PQ. End of Life.
- 100, 3250 Covered Hoppers located off of various class 1s in multiple locations. Sand Cars.
- 5, 2740 Mill Gondolas located off of various class 1s in NC. End of Life.
- 1, 2260 Mill Gondolas located off of various class 1s in AL. End of Life.
- 30, 2740 Mill Gondolas located off of various class 1s in multiple locations. End of Life.
- 21, 2740 Mill Gondolas located off of various class 1s in WA. End of Life.
- 9, 4750 Covered Hoppers located off of various class 1s in multiple locations. End of Life.
- 5, 4750 Covered Hoppers located off of various class 1s in multiple locations. End of Life.
- 50, 31.8K Tank CPC 1232s located off of UP or BN in TX. Requal Due in 2025.
- 100, 4600CF Open Top Hoppers located off of BN or CSX in Southeast. N/A.
Call PFL today to discuss your needs and our availability and market reach. Whether you are looking to lease cars, lease out cars, buy cars, or sell cars call PFL today at 239-390-2885
Live Railcar Markets
| CAT | Type | Capacity | GRL | QTY | LOC | Class | Prev. Use | Offer | Note |
|---|
PFL will be at the Following Conferences

- Where: Loews Arlington Hotel
- Attending: Brian Baker (239.297.4519), David Cohen (954-729-4774), and Curtis Chandler (239-405-3365)
- Conference Website

- Where: The Westin Galleria Dallas
- Attending: David Cohen (954-729-4774), and Curtis Chandler (239-405-3365)
- Conference Website

- Where: The Westin Galleria Dallas
- Attending: Brian Baker (239.297.4519)
- Conference Website