
“Whenever you do a thing, act as if all the world were watching.” – Thomas Jefferson
Jobs Update
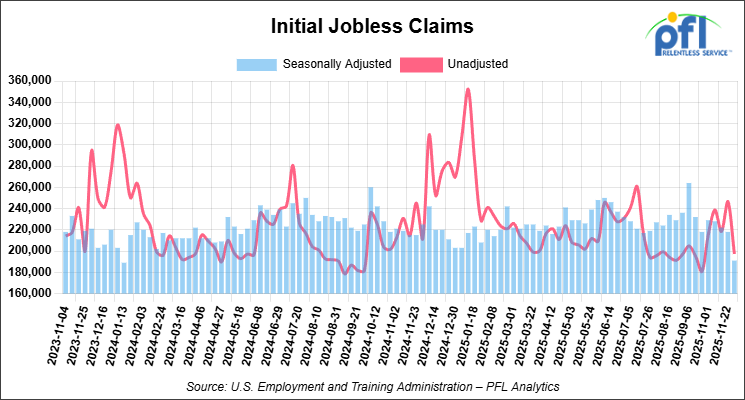
- Initial jobless claims seasonally adjusted for the week ending November 29, 2025 came in at 191,000, versus the adjusted number of 218,000 people from the week prior, down 27,000 people week over week.
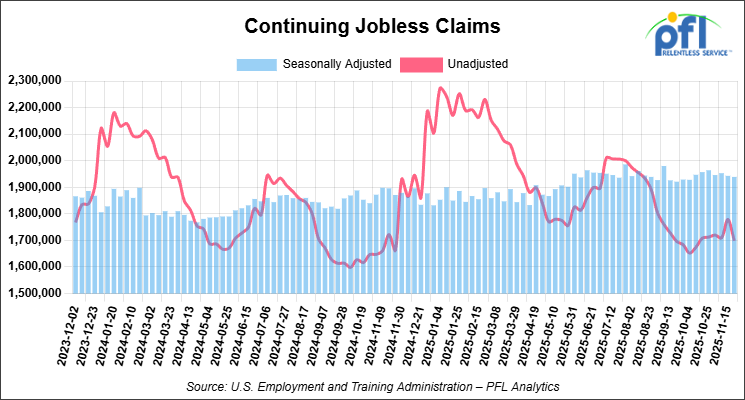
- Continuing jobless claims came in at 1,939,000, versus the adjusted number of 1,943,000 people from the week prior, down 4,000 week-over-week.
Stocks closed higher on Friday of last week and higher week-over-week
The DOW closed higher on Friday of last week, up 104.05 points (0.22%), closing out the week at 47,954.99, up 238.57 points week-over-week. The S&P 500 closed higher on Friday of last week, up 13.28 points (0.19%), and closed out the week at 6,870.40, up 21.31 points week-over-week. The NASDAQ closed higher on Friday of last week, up 72.99 points (0.31%), and closed out the week at 23,578.13, up 212.44 points week-over-week.
In overnight trading, DOW futures traded higher and are expected to open at 48,015 this morning, up 14 points from Friday’s close.
Crude oil closed higher on Friday of last week and higher week-over-week
West Texas Intermediate (WTI) crude closed up 41 cents per barrel (0.7%), to close at $60.08 on Friday of last week, up $1.53 week-over-week. Brent crude closed up 49 cents per barrel (0.8%), to close at $63.75, up 55 cents week-over-week.
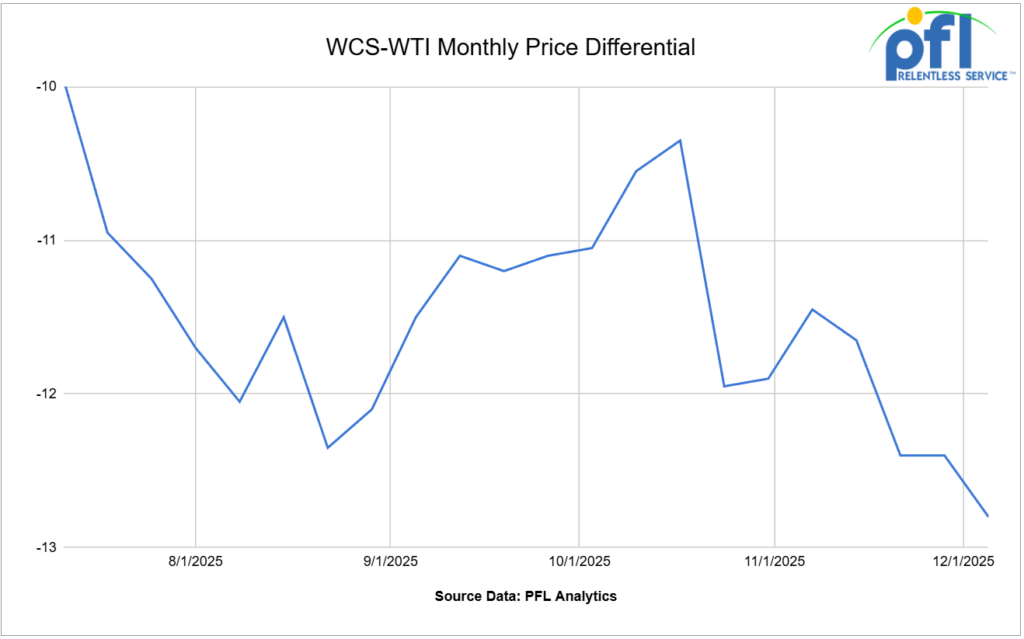
One Exchange WCS (Western Canadian Select) for January delivery settled on Friday of last week at US$12.80 below the WTI-CMA (West Texas Intermediate – Calendar Month Average). The implied value was US$46.43 per barrel.
A recent market survey showed analysts and economists have lowered their price expectations for WTI crude to average $62.00 per barrel in 2026, down $10 per barrel from previous expectations. The IEA expects an oversupply of 4.2 million barrels per day next year, conservative estimates project a 500,000 barrels per day oversupply problem.
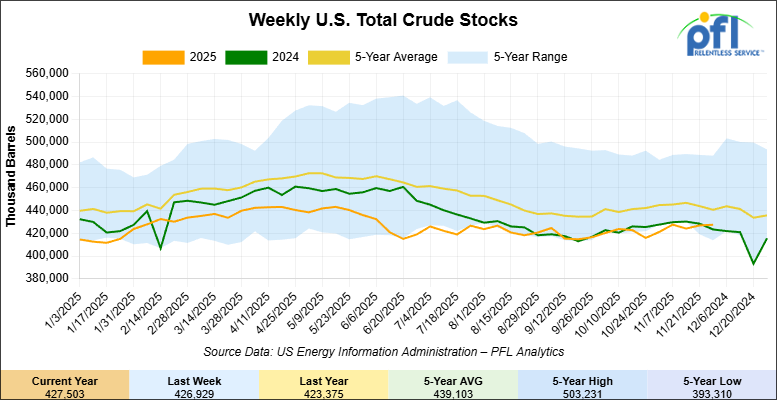
U.S. commercial crude oil inventories (excluding those in the Strategic Petroleum Reserve) increased by 600,000 barrels week-over-week. At 427.5 million barrels, U.S. crude oil inventories are 3% below the five-year average for this time of year.
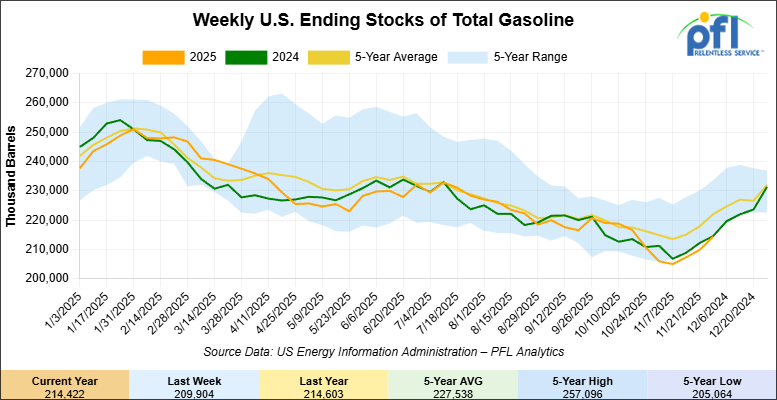
Total motor gasoline inventories increased by 4.5 million barrels week-over-week and are 2% below the five-year average for this time of year.
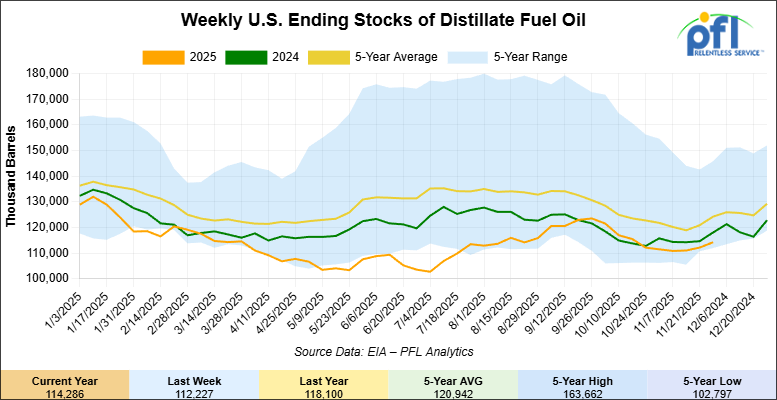
Distillate fuel inventories increased by 2.1 million barrels week-over-week and are 7% below the five-year average for this time of year.
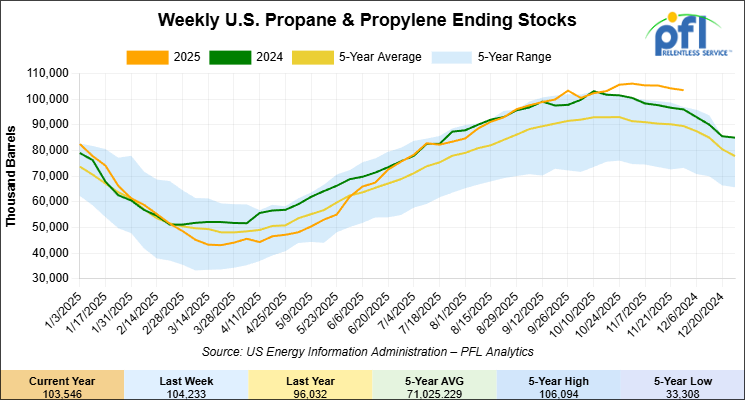
Propane/propylene inventories decreased 700,000 barrels week-over-week and are 15% above the five-year average for this time of year.
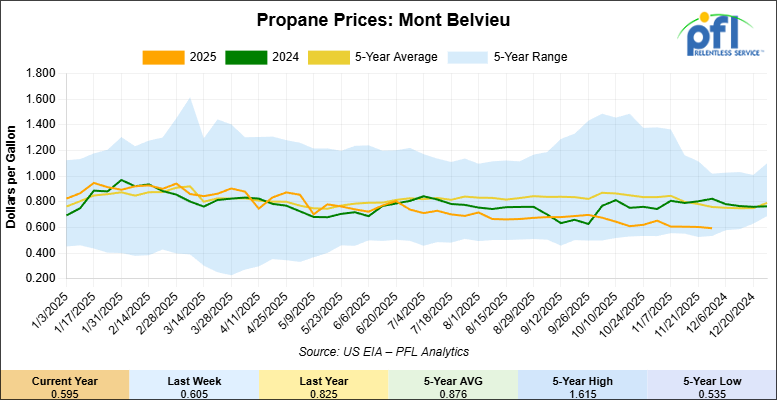
Propane prices closed at 59.5 cents per gallon on Friday of last week, down 1 cent per gallon week-over-week, and down 23 cents year-over-year.
Overall, total commercial petroleum inventories increased by 5.2 million barrels week-over-week during the week ending November 28, 2025.
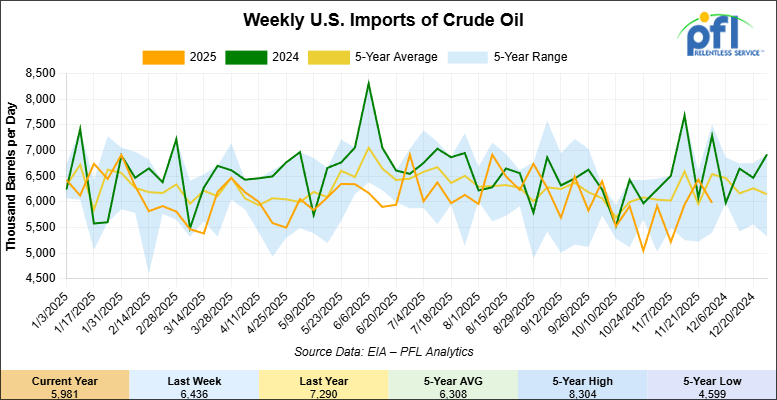
U.S. crude oil imports averaged 6 million barrels per day during the week ending November 28, 2025, a decrease of 456,000 barrels per day from the previous week. Over the past four weeks, crude oil imports averaged 5.9 million barrels per day, 14.4% less than the same four-week period last year. Total motor gasoline imports (including both finished gasoline and gasoline blending components) averaged 772,000 barrels per day, and distillate fuel imports averaged 190,000 barrels per day during the week ending November 28, 2025.
U.S. crude oil exports averaged 3.613 million barrels per day during the week ending November 28, 2025, an increase of 15,000 barrels per day week-over-week. Over the past four weeks, crude oil exports averaged 3.546 million barrels per day.

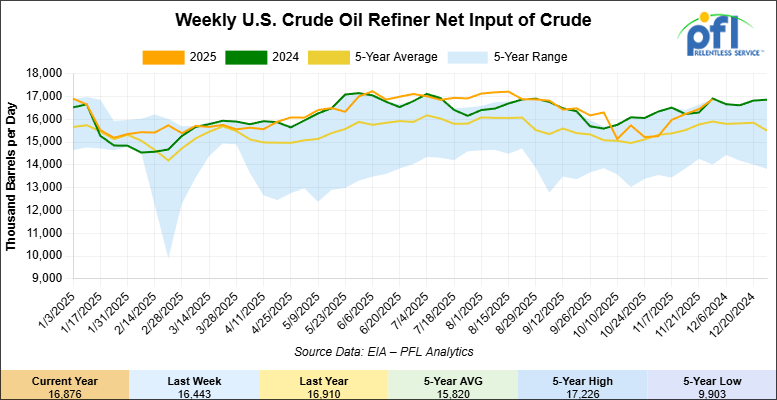
U.S. crude oil refinery inputs averaged 16.9 million barrels per day during the week ending November 28, 2025, which was 433,000 barrels per day more week-over-week.
WTI futures are poised to open at $59.28, up 73 cents from Friday’s close.
North American Rail Traffic
Week Ending December 3, 2025:
Total North American weekly rail volumes were down (-3.09%) in week 49, compared with the same week last year. Total Carloads for the week ending December 3, 2025 were 293,572, up (+2.04%) compared with the same week in 2024, while weekly Intermodal volume was 290,203, down (-7.78%) year over year. 6 of the AAR’s 11 major traffic categories posted year-over-year decreases. The largest decrease came from Forest Products (-22.88%), while the largest increase was Coal (+26.98%).
In the East, CSX’s total volumes were up (+1.43%), with the largest decrease coming from Forest Products (-13.92%), while the largest increase came from Coal (+26.68%). NS’s total volumes were down (-1.58%), with the largest increase coming from Petroleum & Petroleum Products (+35.28%), while the largest decrease came from Other (-14.93%).
In the West, BNSF’s total volumes were down (-5.52%), with the largest increase coming from Grain (+35.90%), while the largest decrease came from Metallic Ores and Metals (-21.22%). UP’s total volumes were down (-2.19%), with the largest increase coming from Coal (+48.75%), while the largest decrease came from Petroleum & Petroleum Products (-16.97%).
In Canada, CN’s total volumes were down (-0.29%), with the largest increase coming from Other (+74.85%), while the largest decrease came from Metallic Ores and Metals (-16.83%). CPKCS’s total volumes were down (-20.25%), with the largest increase coming from Coal (+19.46%), while the largest decrease came from Forest Products (-69.47%).
Source Data: AAR – PFL Analytics
North American Rig Count Summary
Rig Count
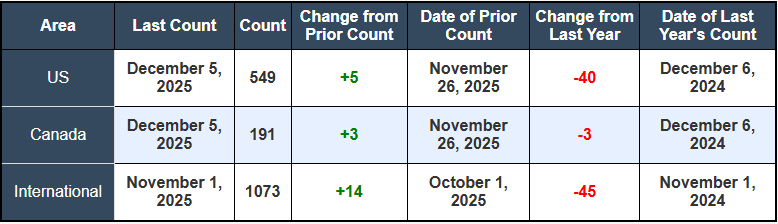
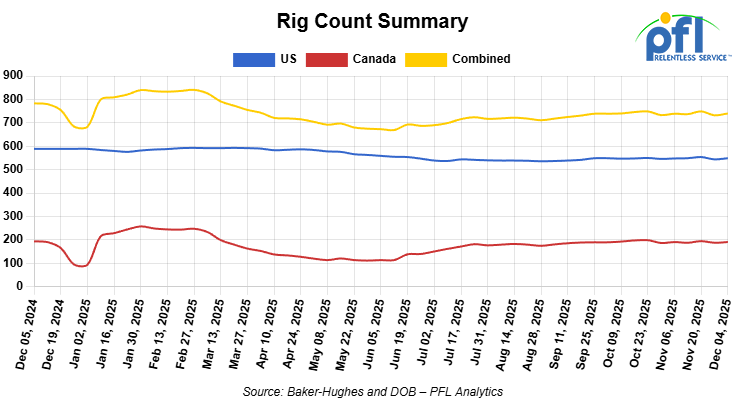
North American rig count was up by +8 rigs week-over-week. The U.S. rig count was up by +5 rigs week-over-week, but down by -40 rigs year-over-year. The U.S. currently has 549 active rigs. Canada’s rig count was up by +3 rigs week-over-week but down by -3 rigs year-over-year. Canada currently has 191 active rigs. Overall, year-over-year we are down by -43 rigs collectively.
We are watching a few things out there for you:
We are watching Petroleum Carloads
The four-week rolling average of petroleum carloads carried on the six largest North American railroads fell to 30,062 from 30,150, which was a decrease of -85 rail cars week-over-week. Canadian volumes were lower. CPKC’s shipments were lower by -15.0% week over week, CN’s volumes were lower by -5.0% week-over-week. U.S. shipments were mostly lower. The NS was the sole gainer and was up by 3%. THe UP had the largest percentage loss and was down by -15.0%.
We are watching Canada’s Hardisty Terminal and DRU.
The market shifted decisively in favor of crude-by-rail last week with three big players coming to the table – ConocoPhillips, Gibson and Strathcona.
The Gibson-ConocoPhillips DRU-bit network at Hardisty is primed to capture significant volumes. Gibson Energy CEO Curtis Philippon announced plans to expand the Hardisty DRU in one to two phases over the next five years, each adding 50,000 barrels per day of capacity for roughly $200 million, that’s 100,000 barrels per day in total!
DRU Facility
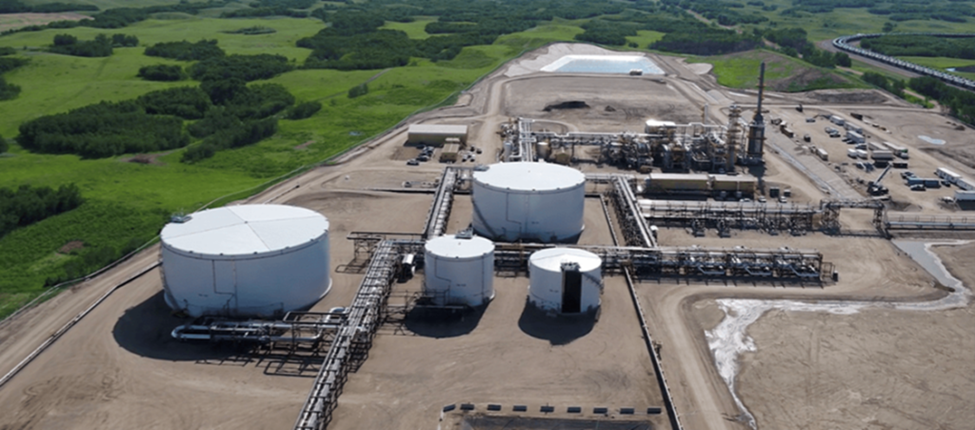
Source: Gibson Energy Inc.
Western Canadian Select (WCS) differentials continued to trend higher last week. One Exchange WCS (Western Canadian Select) for January delivery settled on Friday of last week at US$12.80 below the WTI-CMA (West Texas Intermediate – Calendar Month Average) – the widest spread since March. With Trans Mountain running at 87% utilization and Enbridge continuing to cut their allocations, expect this trend to continue in the short term as Alberta production continues to increase. On the flip side there seems to be a large number of debottlenecking projects going on right now so time will tell once the dust settles. The larger the differential the better it is for crude by rail, particularly as it relates to raw bitumen.
The DRU’s core value is elegantly simple: it strips ~30% diluent from raw bitumen, creating DRUbit – a non-hazmat, non-flammable, refinery-ready product that ships safely by rail and eliminates the need for condensate movements to the U.S. Gulf Coast.
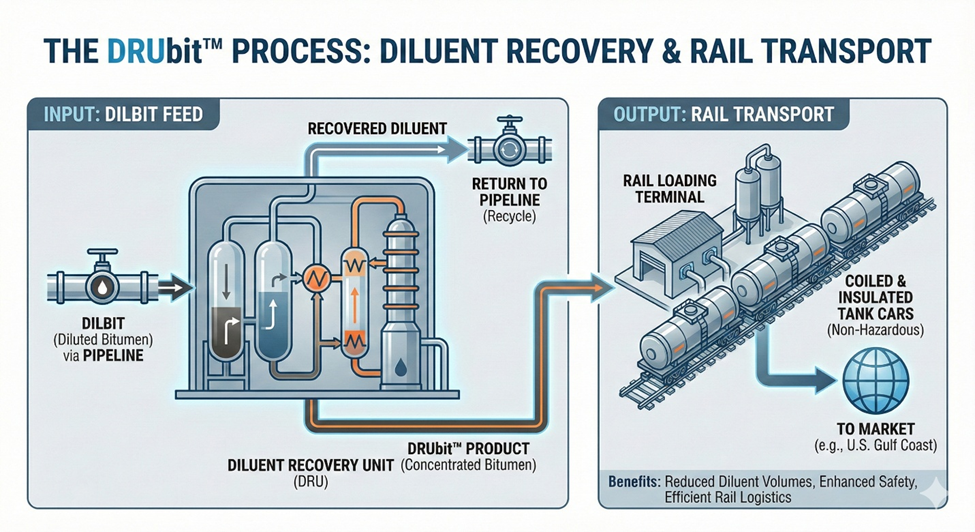
This process transforms the economics of heavy oil transport: Because DRUbit is non-hazardous (unlike Class 3 flammable dilbit), it bypasses the strict hazardous materials regulations that constrain conventional crude-by-rail, lowering insurance costs and community risk.
Economic Netback: Producers avoid paying pipeline tolls on the 30% diluent volume that refiners don’t value. In addition, lower transportation costs are charged by the class 1 railroads because of its nonhazardous designation.
Carbon Footprint: The process reduces CO2e emissions by ~30% compared to dilbit-by-pipe.
Strathcona Resources has doubled down on this model, having acquired the Hardisty Rail Terminal (HRT) in May 2025 for $45 million. As the only rail terminal at Hardisty with 262,000 bpd of capacity (currently just 19% utilized), it provides Strathcona a “natural hedge” against pipeline bottlenecks. Combined with their Hamlin terminal, Strathcona now controls terminals servicing 80% of Western Canada’s crude-by-rail capacity. With ConocoPhillips anchoring the first 50,000 bpd phase and Strathcona pivoting to become a “pure-play heavy oil” producer, this rail corridor is no longer a swing option – it is a core, scalable egress strategy for the 2030s.
Hardisty to Port Authur
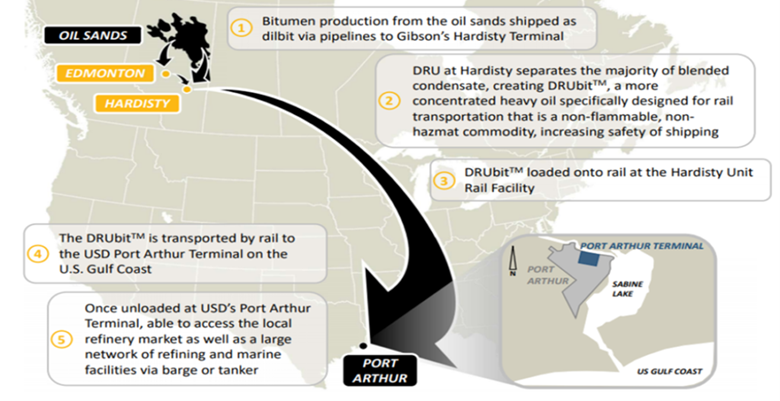
Source: Gibson Energy Inc.
Other refiners throughout the United States are set up to take DRUbit or raw bitumen and is a preferred heavy grade for all the reasons mentioned above.
We are watching left-wing Carney
As touched on in last week’s rail report, Prime Minister Mark Carney signed a memorandum of understanding with Alberta Premier Danielle Smith that marks a seismic shift in federal energy policy. The federal government will scrap its sector-wide emissions cap—a move that immediately removes the biggest regulatory headwind to oil production growth. In exchange, Alberta will commit to a 75% methane reduction by 2035, industrial carbon pricing that escalates to C$130 per ton by 2026, and participation in the Pathways Alliance carbon capture and storage project.
Ottawa now says it will designate a 1 million barrel per day pipeline to Asian markets as a “project of national interest,” fast-tracking approvals and signaling that oil production and export are now compatible with federal economic and national security priorities. Canada boasts the fourth-largest proven oil reserves in the world and is the fourth-largest producer – exceeding Iran, Iraq, and other OPEC members. Canadians view current production levels compared to what is actually being produced under a decade of liberal policies as a “national shame.” Carney seems to be trying to flip that narrative saying oil is now an “asset of national security” and a foundation of economic resilience against U.S. tariff pressure. For rail operators, this removes policy uncertainty, could validate long-term infrastructure investment, and creates certainty that crude egress bottlenecks will be addressed via a mix of pipe and rail, not pipe alone.
We are watching Trans Mountain Pipeline
The Carney government announced it will not privatize Trans Mountain until completion of “optimization” projects designed to boost capacity from 890,000 bbl/d to 1.25 million bbl/d by mid-2027. TMX is already at effective capacity despite being only 13 months old. With pipeline utilization at 87% in Q3 and all December nominations accepted, further production growth has nowhere to go except rail.
TD Cowen estimates that without additional pipe or rail, crude price differentials could blow out again by Q3 2028 once spare capacity is exhausted. Strathcona’s rail terminal bet and Gibson’s DRU expansion directly address this coming crunch. The multi-year regulatory timeline required for new pipeline projects—TMX took 12 years—means that rail’s shorter development cycle (24 months per DRU phase) becomes the safety valve for producers facing stranded barrels if they don’t secure egress commitments now.
We are watching BNSF
BNSF formally petitioned the Surface Transportation Board last week to scrutinize the pending $85 billion UP-Norfolk Southern merger, alleging that UP has engaged in “a pattern of obstructive conduct” meant to deny competitors (including BNSF) access to customers through “delay and deny strategies.” BNSF cited UP’s 1996 merger with Southern Pacific as a cautionary tale: the resulting service meltdown forced the STB to rewrite merger rules entirely.
The filing signals that BNSF will fight the merger as a condition of approval, likely demanding trackage rights, interchange concessions, or divestitures. Port operators, state attorneys general, and railcar shippers have also weighed in against the deal. While UP CEO Jim Vena insists the merger will be approved and notes there is only “a few hundred miles” of network overlap, the regulatory hurdles are now substantial. For rail car operators and shippers, a contested merger could force divestitures, competitive concessions, and operational improvements—potentially fragmenting service routes or requiring alternative routing, which may dampen utilization on certain corridors. The STB filing deadline is mid-December.
We are watching the CPKC
Canadian Pacific Kansas City reported a surge in southbound shipments to Mexico last week, with Canada-bound LPG, refined products, and plastics shipments doubling in 2025 (up $460 million in annual revenue). Tariff-driven fears of US supply disruption are pushing shippers to diversify into Canadian and Mexican suppliers, and CPKC is the only Class I rail network offering seamless single-line access to all three markets.
CEO Keith Creel emphasized that the UP-NS merger poses no competitive threat to CPKC, as the merged entity will be oriented east-west (US coasts), while CPKC dominates north-south flows. This north-south corridor is becoming a strategic asset as the Trump administration’s tariff policies drive supply chain re-routing. For crude-by-rail, it validates the strategic importance of rail networks that can reach markets beyond the traditional US Gulf Coast refining complex.
We are watching Key Economic Indicators
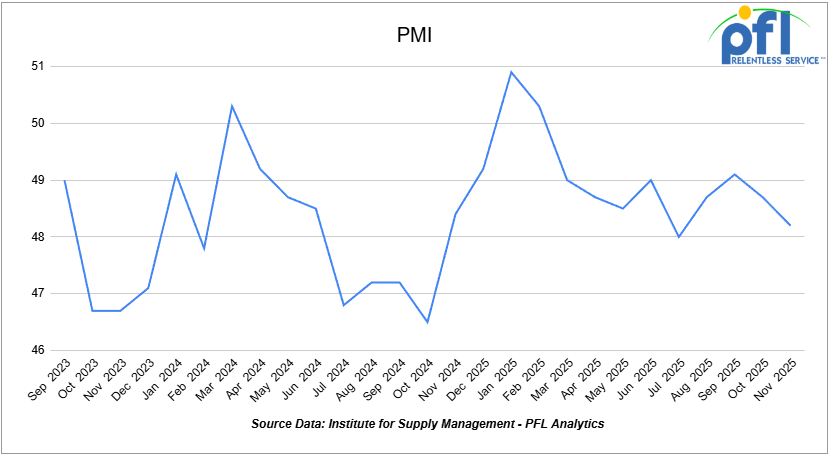
Purchasing Managers Index (PMI)
The Institute for Supply Management releases two PMI reports – one covering manufacturing and the other covering services. These reports are based on surveys of supply managers across the country and track changes in business activity. A reading above 50% on the index indicates expansion, while a reading below 50% signifies contraction, with a faster pace of change the farther the reading is from 50.
The Manufacturing PMI in November was 48.2%, down from 48.7% in October. This remains in contraction territory, marking the ninth straight month below 50%. On the Services PMI side, the most recent reading is 52.6% (November), up from 52.4% in October, signaling continued expansion in the services sector.
Lease Bids
• 30-50, 6000cf Steel Hopper located off of CSX or NS in East. For use in petcoke service. Period: 5 Years.
• 10, 2500CF Open Top Hopper located off of UP or BN in Texas. For use in aggregate service. Period: 5 years. Need Rapid Discharge Doors.
• 50, 23.5-25.5 DOT111 Tank located off of Any Class 1 in USA. For use in Asphalt service. Period: 5 years.
• 100, 21.9K 117J Tank located off of All Class 1s in Midwest. For use in CO2 service. Period: 6 months.
• 30-50, 30K 117J Tank located off of NS or CSX in Northeast. For use in C5 service. Period: 1 year.
Sales Bids
• 28, 3400CF Hopper Covered located off of UP BN in Texas. For use in Cement service.Cement Gates needed..
• 20, 17K Tank DOT111 located off of various class 1s in various locations. For use in corn syrup service.
• 120, Various Gondola Open-Top Aluminum Rotary located off of various class 1s in various locations. For use in Sulphur service.Built 2004 or later.
Lease Offers
• 100, 30K CPC1232 Tanks located off of UP or BN in Texas. Last used in Diesel.
• 100, 30K DOT117J Tanks located off of UP or BN in Texas. Last used in Gasoline.
• 100, 29K DOT117J Tanks located off of UP or BN in Texas. Last used in Gasoline. Coiled and Insulated.
• 36, 6351 Covered Hopper located off of CN in Wisconsin. Last used in Grain. through 2/27.
• 29, 6580 Covered Hopper located off of CN in Wisconsin. Last used in Grain. through 2/26.
• 18, 6580 Covered Hopper located off of CN in Wisconsin. Last used in Grain. through 2/27.
• 9, 5400 Covered Hopper located off of CN in Wisconsin. Last used in Grain. through 2/27.
Sales Offers
• 21, 50′ Boxcar Plate Cs located off of various class 1s in NM. End of Life.
• 3, 50′ Boxcar Plate Cs located off of various class 1s in multiple locations. End of Life.
• 27, 50′ Boxcar Plate Cs located off of various class 1s in PQ. End of Life.
• 100, 3250 Covered Hoppers located off of various class 1s in multiple locations. Sand Cars.
• 5, 2740 Mill Gondolas located off of various class 1s in NC. End of Life.
• 1, 2260 Mill Gondolas located off of various class 1s in AL. End of Life.
• 30, 2740 Mill Gondolas located off of various class 1s in multiple locations. End of Life.
• 21, 2740 Mill Gondolas located off of various class 1s in WA. End of Life.
• 9, 4750 Covered Hoppers located off of various class 1s in multiple locations. End of Life.
• 5, 4750 Covered Hoppers located off of various class 1s in multiple locations. End of Life.
• 50, 31.8K Tank CPC 1232s located off of UP or BN in TX. Requal Due in 2025.
• 100, 4600CF Open Top Hoppers located off of BN or CSX in Southeast.
Call PFL today to discuss your needs and our availability and market reach. Whether you are looking to lease cars, lease out cars, buy cars, or sell cars call PFL today at 239-390-2885
Live Railcar Markets
| CAT | Type | Capacity | GRL | QTY | LOC | Class | Prev. Use | Offer | Note |
|---|
PFL will be at the Following Conferences

- Where: Loews Arlington Hotel
- Attending: Brian Baker (239.297.4519), David Cohen (954-729-4774), and Curtis Chandler (239-405-3365)
- Conference Website

- Where: The Westin Galleria Dallas
- Attending: David Cohen (954-729-4774), and Curtis Chandler (239-405-3365)
- Conference Website

- Where: The Westin Galleria Dallas
- Attending: Brian Baker (239.297.4519)
- Conference Website