
“We don’t see things as they are, we see them as we are.” – Anais Nin
Due to the Government Shutdown, we are unable to report last week’s Jobs Update. We apologize for the inconvenience.
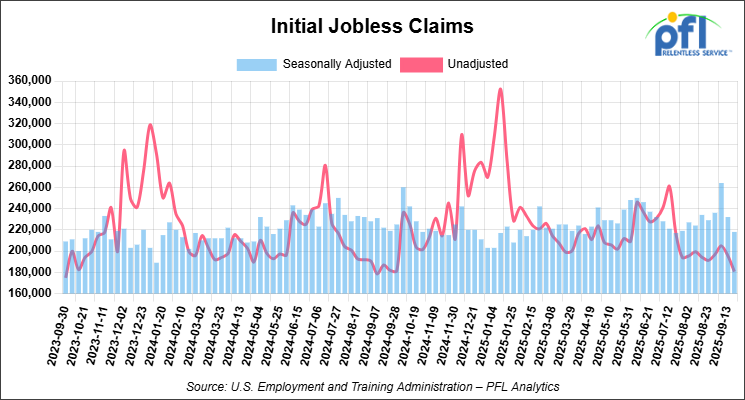
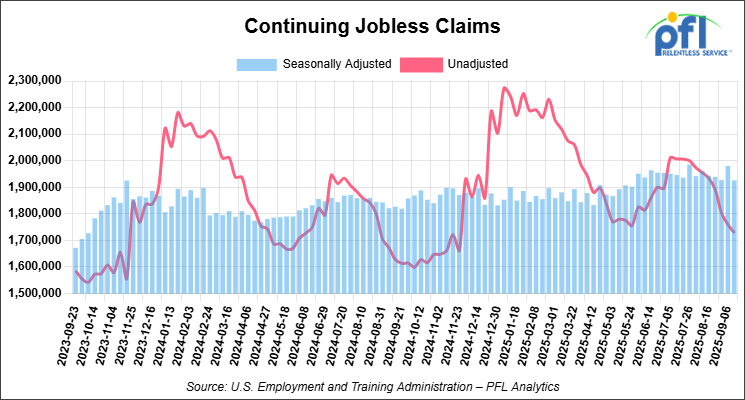
Jobs Update
• Initial jobless claims seasonally adjusted for the week ending September 20, 2025 came in at 218,000, versus the adjusted number of 232,000 people from the week prior, down 14,000 people week over week.
• Continuing jobless claims came in at 1,926,000, versus the adjusted number of 1,980,000 people from the week prior, down 54,000 week-over-week.
Stocks closed mixed on Friday of last week, but lower week-over-week
The DOW closed higher on Friday of last week, up 74.80 points (0.16%), closing out the week at 46,987.10, down -575.77 points week-over-week. The S&P 500 closed higher on Friday of last week, up 8.48 points (0.13%), and closed out the week at 6,728.80, down -111.40 points week-over-week. The NASDAQ closed lower on Friday of last week, down -49.46 points (-0.21%), and closed out the week at 23,004.54, down -720.42 points week-over-week.
In overnight trading, DOW futures traded higher and are expected to open at 47,298 this morning, up 213 points from Friday’s close.
Crude oil closed higher on Friday of last week, but lower week-over-week
West Texas Intermediate (WTI) crude closed up 32 cents per barrel (0.54%), to close at $59.75 on Friday of last week, but down $1.23 week-over-week. Brent crude closed up 25 cents per barrel (0.39%), to close at $63.63, but down $1.44 week-over-week.
One Exchange WCS (Western Canadian Select) for December delivery settled on Friday of last week at US$11.45 below the WTI-CMA (West Texas Intermediate – Calendar Month Average). The implied value was US$47.80 per barrel.
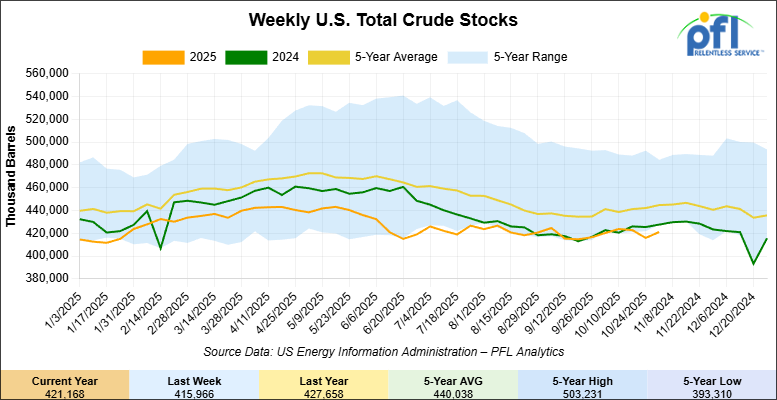
U.S. commercial crude oil inventories (excluding those in the Strategic Petroleum Reserve) increased by 5.2 million barrels week-over-week. At 421.2 million barrels, U.S. crude oil inventories are 4% below the five-year average for this time of year.
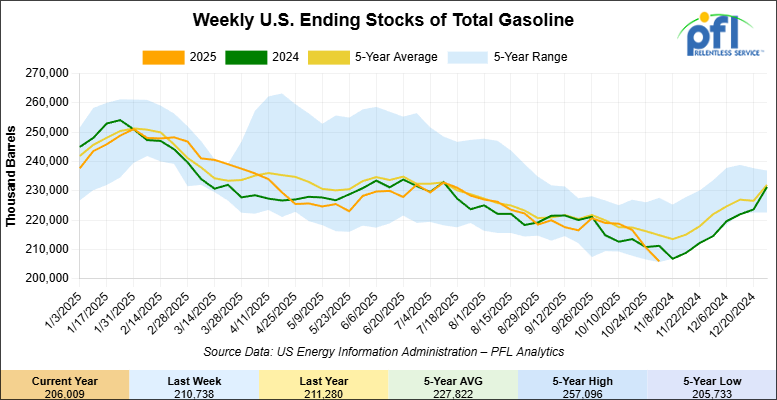
Total motor gasoline inventories decreased by 4.7 million barrels week-over-week and are 5% below the five-year average for this time of year.
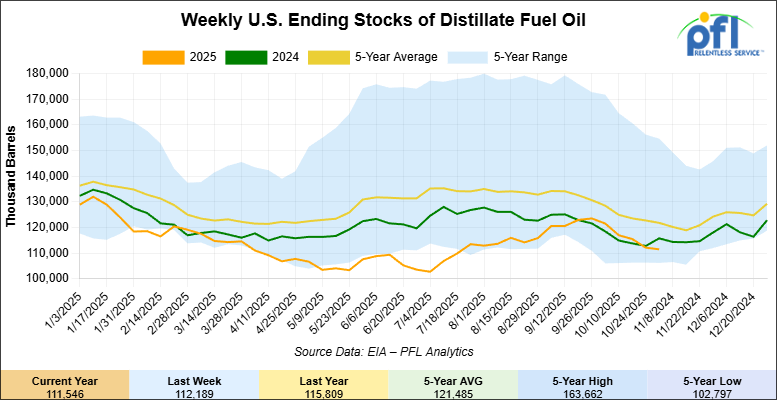
Distillate fuel inventories decreased by 600,000 barrels week-over-week and are 9% below the five-year average for this time of year
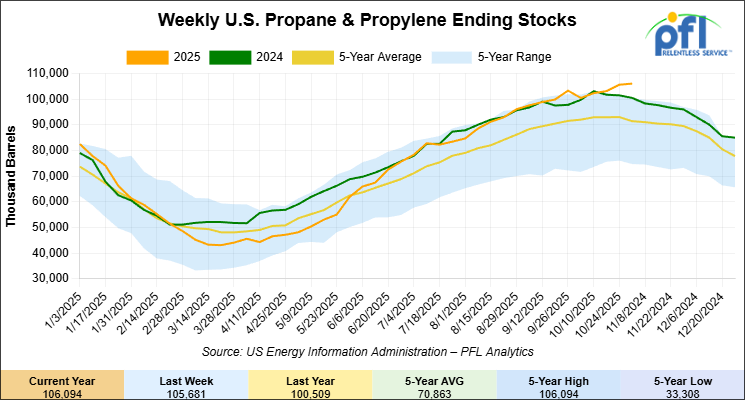
Propane/propylene inventories increased by 400,000 barrels week-over-week and are 15% above the five-year average for this time of year.
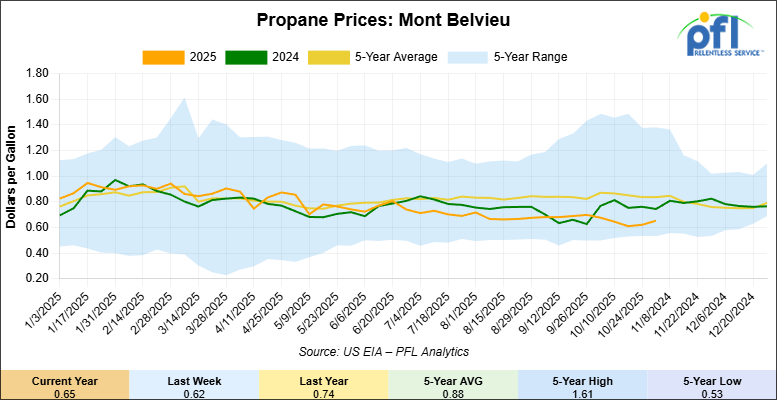
Propane prices closed at 65 cents per gallon on Friday of last week, up 3 cent per gallon week-over-week, but down by 10 cents per gallon year-over-year.
Overall, total commercial petroleum inventories increased by 600,000 barrels during the week ending October 31, 2025.
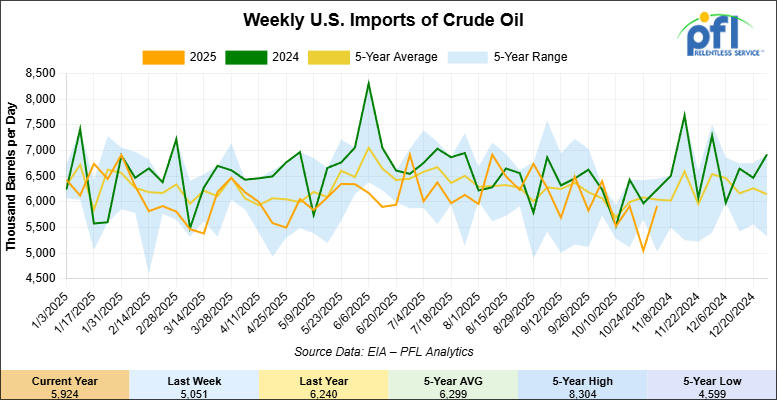
U.S. crude oil imports averaged 5.9 million barrels per day during the week ending October 31, 2025, an increase of 873,000 barrels per day week-over-week. Over the past four weeks, crude oil imports averaged 5.6 million barrels per day, 7.3% less than the same four-week period last year. Total motor gasoline imports (including both finished gasoline and gasoline blending components) averaged 588,000 barrels per day, and distillate fuel imports averaged 104,000 barrels per day during the week ending October 31, 2025.
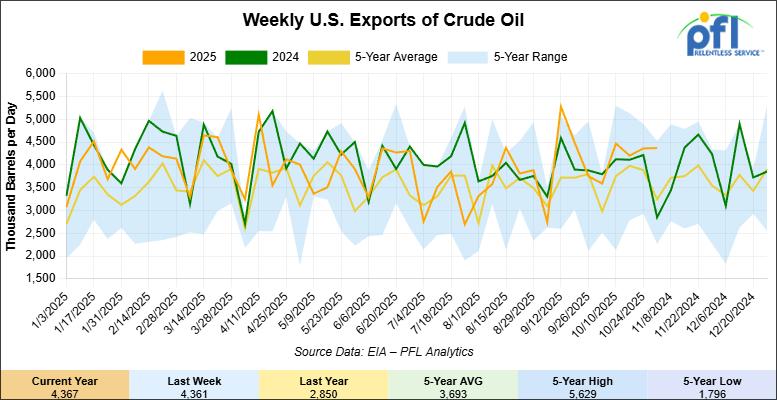
U.S. crude oil exports averaged 4.367 million barrels per day during the week ending October 31, 2025, an increase of 6,000 barrels per day week-over-week. Over the past four weeks, crude oil exports averaged 4.349 million barrels per day.
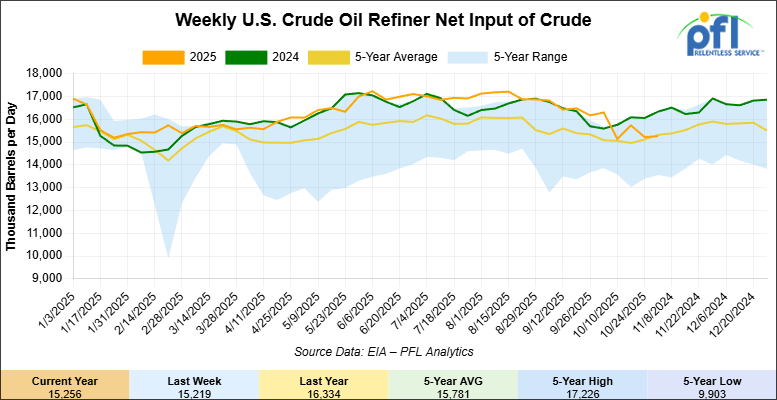
U.S. crude oil refinery inputs averaged 15.3 million barrels per day during the week ending October 31, 2025, which was 37,000 barrels per day more week-over-week.
WTI futures are poised to open at $59.89, up 14 cents from Friday’s close.
North American Rail Traffic
Week Ending November 1, 2025
The Association of American Railroads (AAR) reported total U.S. rail traffic for the week ending November 1, 2025, at 496,928 carloads and intermodal units, down 3.9% compared with the same week last year. Total carloads were 227,209, a decrease of 0.7%, while weekly intermodal volume totaled 269,719 containers and trailers, down 6.4% year-over-year.
Four of the ten major carload commodity groups posted increases compared with the same week in 2024. The strongest gains were in grain, up 1,521 carloads to 25,171; metallic ores and metals, up 1,097 carloads to 21,151; and miscellaneous carloads, up 780 carloads to 9,517. The largest declines were reported in coal, down 1,878 carloads to 55,508; motor vehicles and parts, down 1,672 to 14,917; and nonmetallic minerals, down 564 to 32,563.
For the first forty-four weeks of 2025, U.S. railroads reported a cumulative total of 9,780,010 carloads, up 1.9% from the same point last year, and 11,942,436 intermodal units, up 2.8%. Combined U.S. rail traffic through week forty-four stood at 21,722,446 carloads and intermodal units, an overall increase of 2.4% compared with 2024.
Across North America, total rail traffic for the week reached 688,664 carloads and intermodal units, down 3.1% compared with the same week last year. Carloads totaled 333,804, down 1.9%, while intermodal units declined 4.2% to 354,860. Cumulative North American volume for the first forty-four weeks of 2025 was 29,913,818 carloads and intermodal units, up 2.0% compared with 2024.
In Canada, total rail traffic for the week was 166,462 carloads and intermodal units, with carloads down 1.8% to 95,112 and intermodal traffic up 1.9% to 71,350. Canadian railroads reported cumulative volume of 7,132,476 units through week forty-four, up 1.7% from the same period in 2024.
In Mexico, rail activity was mixed compared with last year. Mexican railroads originated 11,483 carloads, down 21.3%, and 13,791 intermodal units, up 12.9% year-over-year. Total weekly traffic in Mexico amounted to 25,274 carloads and intermodal units, down 6.7% compared with the same week in 2024. Cumulative Mexican rail volume through the first forty-four weeks of 2025 totaled 1,058,896 units, down 3.7% from the same point last year.
Source Data: AAR – PFL Analytics
North American Rig Count Summary
Rig Count
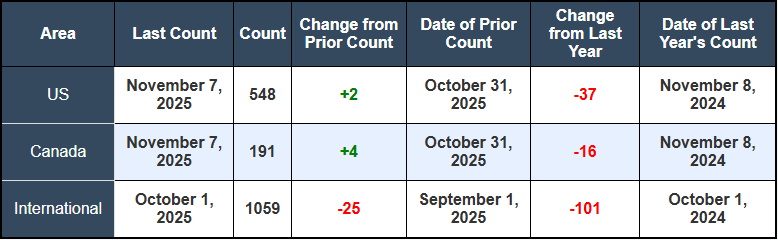
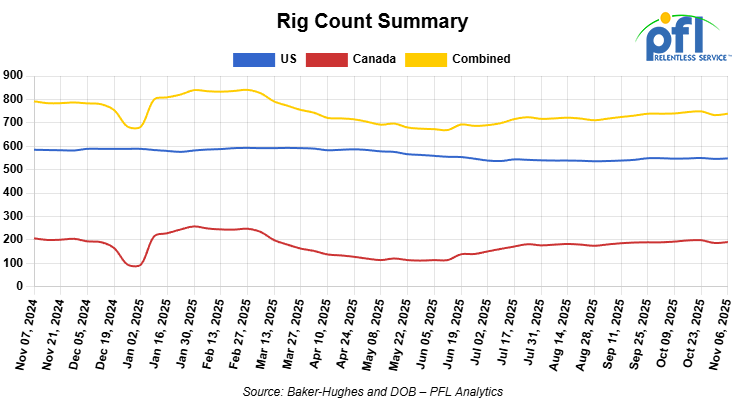
North American rig count was up by +6 rigs week-over-week. The US rig count was up by +2 rigs week-over-week, but down by -37 rigs year-over-year. The US currently has 548 active rigs. Canada’s rig count was up by +4 rigs week-over-week, but down by -16 rigs year-over-year. Canada currently has 191 active rigs. Overall, year-over-year, we are down by -53 rigs collectively.
International rig count, which is reported monthly, was down by -25 rigs month-over-month and down by -101 rigs year-over-year. Internationally, there are 1059 active rigs
We are watching a few things out there for you:
We are watching Petroleum Carloads
The four-week rolling average of petroleum carloads carried on the six largest North American railroads rose to 28,913 from 28,879, which was an increase of +34 rail cars week-over-week. Canadian volumes were lower. CPKC’s shipments were lower by -8.0% week over week, CN’s volumes were lower by -5.0% week-over-week. U.S. shipments were mostly higher. The NS was the sole decliner and was down by -5.0%. The UP had the largest percentage increase and was up by +8.0%.
We Are Watching Enbridge
A new “pipeline-on-pipeline” joint venture is poised to displace some long-haul Canadian crude-by-rail (CBR) (or absorb rising Canadian production) volumes destined for the U.S. Gulf Coast.
Enbridge is advancing its Mainline Optimization Phase 2 (MLO2) project, which has been upsized to 250,000 barrels per day. The project is a strategic masterstroke: instead of building a new pipeline, Enbridge will utilize lagging space on Energy Transfer’s (ET) 750,000 barrels per day Dakota Access Pipeline (DAPL).
DAPL’s primary feedstock, Bakken crude, has leveled off at 550,000 barrels per day, as its producers are looking at maintaining production rather than growing it, leaving significant spare capacity on the line. The solution is for Enbridge to move 250,000 b/d of heavy Canadian crude onto DAPL at Patoka, Illinois, for the final leg to the US Gulf Coast. This move is not a temporary fix; ET is working on 15-year agreements with Canadian producers, locking in these volumes into the 2040s.
This JV, combined with Enbridge’s 150,000 b/d MLO1 project, is aimed directly at US refiners like Valero and Phillips 66, who are planning for a heavier crude diet. The new pipeline capacity effectively renders some long-haul CBR economically extinct. The CBR market has been remarkably resistant given the addition of the Trans Mountain Expansion (TMX), which helped to debottleneck the Canadian system. With no new pipelines on the horizon these debottleneck projects with existing infrastructure are welcomed by the Canadian Producer and have full support of the Alberta and Saskatchewan governments.
The new pipeline route is profoundly cheaper, creating a viability gap that rail cannot bridge. Sending a unit train from Alberta to the U.S. Gulf Coast is roughly $15 per barrel while moving it via pipeline is $9 and change.
We Are Watching The BNSF and the Swinomish Tribe
In a contradictory development, a critical niche CBR route is re-opening, not due to economics, but as a “lesser of two evils” in a complex legal and environmental trade-off.
BNSF has reached a resolution with the Swinomish Tribe, settling a high-profile lawsuit. A federal judge had previously ordered BNSF to pay nearly $395 million for “intentionally, consciously and knowingly” violating a 1991 easement by running unpermitted Bakken crude unit trains to Anacortes, Washington, from 2012 to 2021.
As a result of the litigation, BNSF halted the oil shipments in 2021, shutting down this key supply route for PADD 5 refiners.
The new settlement establishes a new ‘business relationship’ with a critical new term: BNSF is now permitted to run up to one unit train… including those transporting crude across the easement, each day.
The Tribe’s chairman stated the agreement will reduce the number of marine tankers supplying the Anacortes refineries. For the fishing-dependent tribe, the risks marine tankers pose to their treaty fishing rights are seen as a greater threat than the predictable, limited, and managed risk of one crude train per day.
We are watching Renewables
The EPA on Friday of last week continued to address its log of outstanding petitions from small refineries seeking exemption from Renewable Fuel Standard compliance, denying two requests, fully approving 2 and partially approving 12.
For the 2024 RFS compliance year, the agency denied one small refinery exemption (SRE) petition, fully approved another and partially approved two. Following those decisions, the EPA’s online SRE dashboard shows only one petition remaining for 2024.
The agency moved to fully approve one petition for 2023 compliance, offered partial approval for four and denied one. That leaves two (2)outstanding petitions for 2023 compliance.
The agency on Friday said last week’s ruling “is part of the Trump EPA’s commitment to get the RFS program back on track with an approach that recognizes some small refineries are impacted more significantly than others and that EPA’s relief should reflect those differences.”
“With most of the old petitions now cleared, EPA is committed to working with DOE to address new petitions as quickly as possible and within the 90-day statutory review period, a stark contrast from the Biden-Harris Administration which did not act on a single one,” the agency said.
The National Oilseed Processors Association and the American Soybean Association issued a joint statement on the update, in which the groups said, “another 500+ million RINs of lost demand is the last thing our soybean farmers and processors need right now.”
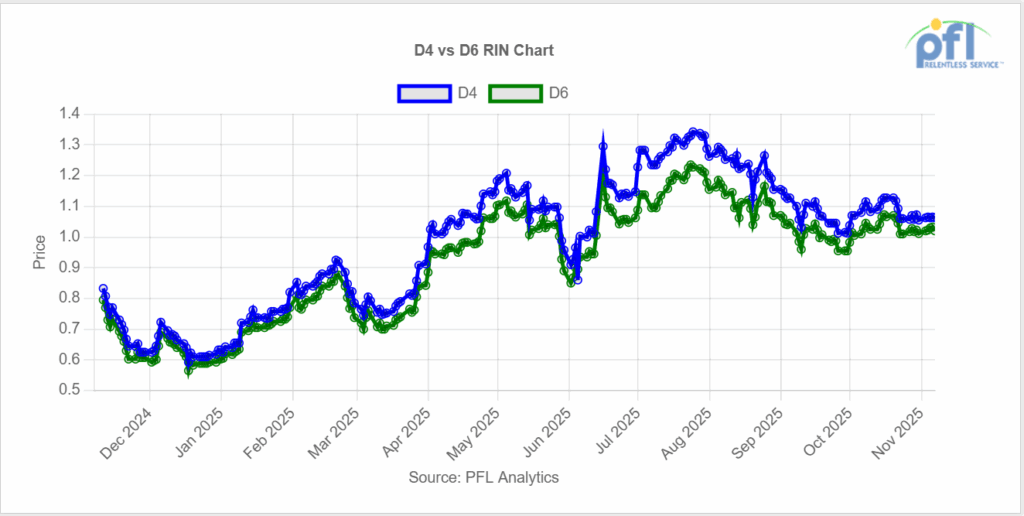
On the back of the news, the RIN market was slow and muted on Friday of last week. D4 RINs settled at $1.00 and ½ of a cent per RIN, down ½ of a cent per RIN day-over-day, but up 1 cent per RIN week-over-week. D6 RINs also closed at $1.00 and ½ per RIN no change day over day, but up 2 cents per RIN week-over-week.
Meanwhile in Ethanol, the EIA weekly data last week reported record Ethanol production during the last week of October, coupled with lower demand. Production was 1.1123 million barrels per day during the last week of October, ethanol plants increased output 32,000 barrels per day 1.6% more than the same week last year. Despite the record production, Ethanol at Argo closed at $1.81 and ½ of a cent per gallon on Friday of last week, up 7 cents per gallon week-over-week.
We Are Watching Cenovus and MEG Energy
After a dramatic, months-long takeover battle, Cenovus Energy has cleared its final major hurdle to acquire MEG Energy. MEG shareholders approved the C$8.6 billion ($6.2 billion) acquisition this week with more than 86% support, well over the two-thirds majority required.
The vote’s success marks the end of a contentious saga that included three separate vote delays and a hostile bid from Strathcona Resources. The stalemate broke only after Cenovus sweetened its offer twice and struck a crucial side-deal with Strathcona. Cenovus agreed to sell C$150 million in assets, including its Vawn thermal facility, to Strathcona; in exchange, Strathcona, which held a 14.2% stake in MEG, agreed to vote its shares in favor of the Cenovus acquisition.
Cenovus and MEG operate adjacent, side-by-side thermal properties at Christina Lake. Cenovus expects to generate over C$400 million in annual synergies by 2028, primarily by integrating these operations.
This integration is directly tied to a planned increase in production. The deal immediately adds MEG’s 110,000 barrel-per-day (b/d) output to Cenovus’s portfolio. Cenovus plans to leverage unused capacity and new steam generators to boost the acquired MEG site’s output to 150,000 b/d by 2028. This is part of a broader strategy to grow total company output to 850,000 barrels of oil equivalent per day (boe/d) by 2028.
This consolidation and production growth is occurring in a newly de-risked environment for Canadian producers. The Trans Mountain pipeline expansion is now complete, adding 590,000 b/d of new egress capacity, and the Carney budget is signaling its intent to scrap the federal oil and gas emissions cap. The combination of major consolidation, planned production growth, and improved pipeline and regulatory tailwinds signals a significant strengthening of Canada’s largest oil sands producers.
We Continue to watch the UP and the NS
The proposed $85 billion combination of Union Pacific (UP) and Norfolk Southern (NS), which would create the first true transcontinental U.S. railroad, is now accelerating toward its first regulatory and political battles. While the initial hurdle—a special shareholder vote scheduled for November 14—is expected to pass, it is largely a formality. The substantive battle begins with the filing of the complete application with the Surface Transportation Board (STB). UP management has accelerated this timeline, signaling an intent to file in late November or before December 2025, well ahead of the original January 2026 target.
This acceleration is a direct response to the rapid crystallization of a formidable, three-front opposition campaign.
- The Political Front: A powerful, bipartisan coalition of 18 U.S. Senators—led by Sen. Amy Klobuchar (D-Minn.) and Sen. John Hoeven (R-N.D.)—sent a formal letter to the STB urging rigorous and comprehensive evaluation of the merger. The letter’s focus demonstrates the political power of the agricultural lobby, expressing deep concern over the deal’s potential to reduce competition, raise rates, and damage the agricultural supply chain.
- The Competitor Front: The remaining Class I carriers have formed a rare, united front in opposition. CPKC was the first to publicly declare the merger not in the public interest, publishing a detailed factsheet arguing the deal would create a massive organization that dwarfs its competitors and would control approximately 40% of all U.S. rail freight. BNSF, under the Berkshire Hathaway umbrella, has mobilized its own opposition campaign, preserve-rail-competition. BNSF’s core argument is that a combined UP-NS would use its new scale to bundle captive shippers and achieve operational dominance of key gateways. Canadian National (CN) has also joined the opposition chorus.
While the political and competitor fronts are unified, a critical, non-obvious development has occurred on the labor front. UP management has successfully fractured the opposition coalition by neutralizing its most powerful labor component. The SMART-TD union, which had initially voiced immediate and significant concerns and positioned itself as the face of the opposition, was brought to the bargaining table. The result, announced on September 22, is a binding, written Jobs For Life! agreement. This agreement, which takes effect if and when the STB approves the merger, guarantees that no current UP or NS employee represented by SMART-TD will face furlough for the entirety of their careers. This is a tactical victory for UP, as it removes the powerful, politically-sympathetic voice of labor from the STB’s opposition chorus. However, it is a profound, and perhaps fatal, strategic admission. Labor synergies are the easiest, most reliable, and most significant source of savings in any large-scale industrial merger. By guaranteeing $0 in savings from its largest unionized workforce, UP is implicitly confirming the worst fears of both shippers and regulators. This concession effectively telegraphs that the $85 billion cost of the merger, and the returns for shareholders, must be financed through other means. With labor efficiencies off the table, the only remaining lever is market power and the ability to raise rates on an expanded base of captive shippers. This agreement proves the 18 Senators’ and BNSF’s arguments are not just hypothetical, but are the core financial rationale of the deal.
The primary challenge to the merger is not political or commercial, but legal. This will be the first-ever Class I merger reviewed under the STB’s stringent 2001 merger guidelines. Proponents of the deal may point to the STB’s 2023 approval of the Canadian Pacific-Kansas City Southern (CP-KCS) merger as a sign of a new, pro-consolidation regulatory era. This is a fundamentally flawed and dangerous misreading of the regulatory landscape. The CP-KCS deal was explicitly exempted from the 2001 rules; it was judged under the older, pre-2001 regulations due to a waiver for KCS. The STB approved that deal precisely because it combined the two smallest Class I carriers to create a new, end-to-end North-South network that was deemed pro-competitive, as it provided new options against the larger UP and BNSF incumbents. The UP-NS proposal is the exact regulatory inverse. It seeks to combine two of the largest carriers in a way that would, by its very nature, reduce East-West competitive options, creating a duopoly that CPKC and BNSF argue would reduce competition. Under the 2001 rules, UP and NS bear the burden of proving that their combination will actively enhance competition, not merely preserve it. Given the network overlaps, the reduction in gateway choices, and the unified opposition from every other carrier and major shipper group, it is legally and logically very difficult for this merger to meet that standard.
The November 14 shareholder vote is academic; it will pass. The $2.5 billion reverse termination fee embedded in the agreement underscores the massive regulatory risk both parties already acknowledge. This merger will be tied up in STB proceedings (Docket No. FD 36873) throughout 2026 and likely into 2027. The combined weight of the 2001 enhanced competition legal standard, a hostile political environment unified around protecting agricultural shippers, and the unprecedented, unified opposition from all other Class I competitors creates a difficult situation for UP and NS.
We are watching the CPKC
On November 5, CPKC announced it had reached 13 new tentative collective bargaining agreements in the United States. These five-year deals cover 363 employees in 10 states across the complex patchwork of its new U.S. network (including the Delaware & Hudson, Soo Line, and Kansas City Southern properties). The agreements, which are pending ratification, cover key unions including the Brotherhood of Railway Carmen, TCU/IAM, ARASA, and NCF&O. After a disruptive Canadian labor dispute hampered its 2024-25 grain performance, CPKC management is demonstrating a clear priority: operational stability. This is a low-cost, high-value move to de-risk its U.S. network, lock in labor peace for five years, and provide the service continuity that shippers demand.
In a similar move of blocking and tackling, BNSF announced on November 4 that it is expanding its Shortline Select program, which was first launched in the fall of 2024. The two new partners are Northern Lines Railway (NLR) in North Dakota and Columbia Basin Railroad (CBRW) in Washington state. The program, which now includes nine short line partners, is designed to create tighter operational and commercial bonds to defend the high-margin carload freight franchise. A significant portion of carload traffic originates or terminates on a short line, making it vulnerable to leakage to the trucking sector. This program is the unglamorous, essential, and highly effective work of improving interchange efficiency and protecting the core business.
We Are Watching Canadian Grain
The Canadian grain transportation network is presenting two dueling narratives that, on the surface, appear contradictory. In reality, they are two symptoms of the same systemic problem: a crisis of velocity, not capacity.
The Success Narrative (The Railway View): By the metric of sheer volume, the railways are performing at an all-time-high level. CN announced it set a new all-time monthly record for grain movement in October 2025, moving 23.4 million tonnes. It also achieved a company first by moving over 800,000 metric tonnes for three consecutive weeks. CPKC is matching this intensity, posting a new weekly record of 718,015 metric tonnes in Week 13 (Oct 26-Nov 1).
The Failure Narrative (The Shipper View): Beneath these headline numbers, the shipper experience is one of service collapse. The Ag Transport Coalition’s November 3 report stated that for the 2024-25 crop year, CN and CPKC fulfilled only 56% and 62% of shipper orders on-time, respectively. This poor performance has forced CN to ration (i.e., refuse or cancel) 12,000 shipper orders this grain year alone, with 8,600 of those cancellations occurring in the last 2.5 months at the peak of harvest demand.
The discrepancy is explained by the type of service failure. Other data from Week 12, for example, shows that the total number of cars supplied by CN and CPKC was high (95% and 93%, respectively). Therefore, the crisis is not a lack of railcars or locomotives. The problem is velocity and predictability. Cars are arriving, but they are arriving days or weeks late, breaking the fragile, high-cadence supply chain that connects prairie elevators to port terminals. The 12,000 rationed CN orders is the most telling figure. It represents the delta between actual market demand and the system’s maximum structural throughput. The record volumes are not a sign of success, but are simply the statistical measurement of a system running at 100% of its broken, constrained capacity.
The binding constraint on the entire western Canadian supply chain is not railcars, but infrastructure. The data allows for the identification of the exact chokepoint: the Port of Vancouver, and specifically, the CN-owned Second Narrows Rail Bridge. This is a single-track, vertical-lift bridge that provides the only rail access to the critical North Shore export terminals, which handle a significant portion of Canada’s bulk exports. The bridge’s core operational flaw is that marine traffic has the right-of-way over rail traffic. Every time the bridge must be raised for a vessel, the entire rail corridor to the North Shore grinds to a halt. This creates a backlog that cascades backward, stopping trains in their tracks and eventually preventing elevators on the Prairies from loading. This structural flaw is exacerbated by weather. Rainy conditions at the port, which are common in the fall, frequently force terminals to stop loading vessels, which in turn means they cannot unload railcars. This creates a second bottleneck that compounds the bridge-related delays.
Map of Vancouver area Traffic
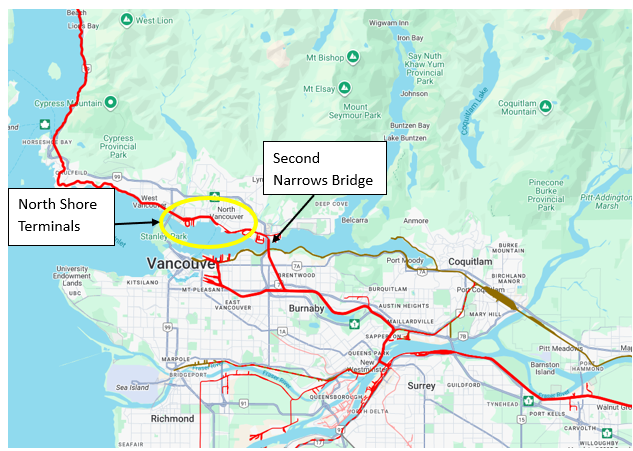
Source: PFL Analytics
CN is projecting a lower grain movement for the 2025-26 crop year (27-29.5 million metric tonnes), while CPKC is projecting a higher one (up to 34 million metric tonnes). These projections are largely irrelevant. As long as the Second Narrows Rail Bridge remains a single-track chokepoint governed by marine right-of-way, the entire network has an immutable ceiling. Until this structural bottleneck is addressed with new infrastructure or new operational rules, the dynamic of record volumes co-existing with systemic service failure will continue. Shipper-railway relations will remain toxic, as railways are simultaneously moving record tonnage and leaving shipper revenue on the table.
We continue to watch Left Wing Canadian Prime Minister Carney
Left-wing Prime Minister Mark Carney’s first federal budget, titled Canada Strong, is advertised as a generational investment plan designed to spur growth and productivity. The budget’s core premise is a strategic pivot to make the Canadian economy more resilient and less dependent on the United States, which is seen as an unreliable partner due to ongoing trade wars and tariffs. This vision is underpinned by a fiscal paradox. The plan calls for $141 billion in new spending over five years while simultaneously cutting $60 billion in operational spending, including a 10% reduction in the federal public service. The result is a projected 2025-26 federal deficit of $78 billion—more than double the previous year and the second-largest in Canadian history. The government’s goal is to use this deficit-financed spending to catalyze private sector investment and counter the economic rupture from U.S. protectionism.
The most critical and complex part of the Carney budget for the rail industry is its new climate competitiveness strategy. This framework creates a direct, long-term, negative headwind for the entire rail-served industrial economy. The policy operates in three distinct parts:
- Consumer Tax: Eliminated. The federal fuel charge (the consumer carbon tax) was cut to $0 through regulation, providing immediate price relief at the pump.
- Industrial Tax (OBPS): Strengthened. The industrial carbon pricing system (the Output-Based Pricing System, or OBPS) is maintained and will be strengthened. This tax applies to large emitters—the core customers of freight rail, including steel mills, auto plants, chemical facilities, and cement producers.
- Border Tax (CBAM): Implemented. The government is moving forward with a Carbon Border Adjustment Mechanism (CBAM), which is effectively a tariff on imports from countries with weaker carbon regulations.
The political irony of this framework is exquisite. Carney’s stated goal is to protect Canadian industry from U.S. (Trump) protectionism. However, Canada’s largest trading partner, the United States, has no federal carbon tax. By increasing the industrial carbon tax (OBPS), Carney is unilaterally raising the input costs for every major Canadian manufacturer. The CBAM is designed to punish imports from the U.S., but it does nothing to help Canadian companies export to the U.S. on a level playing field. Therefore, Carney’s policy, in its attempt to be pro-climate and anti-Trump, is a direct subsidy for U.S. manufacturing. It makes Canadian steel, aluminum, and auto parts less competitive than their American counterparts, effectively doing President Trump’s protectionist work for him by encouraging capital and jobs to flee Canada for the U.S. This is a five-year, structural, negative headwind for the entire rail-served industrial economy.
The budget’s nation-building infrastructure spending is split into two distinct categories: tangible, funded projects and aspirational, political rhetoric.
- Reality (Tangible): The most significant, rail-positive item in the budget is the $5 billion Trade Diversification Corridors Fund. This is real, allocated money to invest in rail, ports, and infrastructure to improve access to non-U.S. markets. This fund includes a specific commitment of $180 million over five years for the Port of Churchill and the Hudson Bay Railway, a legitimate Arctic gateway project that could open new routes for grain and critical minerals.
- Rhetoric (Aspirational): The budget’s headline-grabbing project is the Alto High-Speed Rail (HSR) line, a 1,000 km corridor from Toronto to Québec City. The Prime Minister’s Office and the budget itself promise that a new Major Projects Office (MPO) will cut the original eight-year timeline in half and enable construction to start in four years.
This 4-year promise is political fiction. The government’s claim is directly contradicted by its own project authority, Alto. Alto’s official corporate website, What’s Happening, lays out the actual project timeline.
- Alto’s timeline states the crucial design and development phase began in March 2025 with the selection of the “Cadence” consortium.
- This development phase is expected to last around 5 years.
Therefore, the government’s 4-year start construction promise is politically impossible, as it falls one year short of its own project authority’s 5-year development timeline. The project remains, as it has for 40 years, political vaporware designed for headlines, not a serious, near-term infrastructure reality.
We Are Watching Railcar Markets
The extreme railcar manufacturing uncertainty identified earlier in the year has now been confirmed by hard data. The market is not just uncertain; it is in a clear trough, defined by elevated railcar prices, tariff concerns, and broader economic softness. The Railway Supply Institute’s (RSI) ARCI statistics for the Third Quarter of 2025 paint a stark picture of a market in contraction. Q3 saw orders of 3,071, deliveries of 7,255 with a backlog of 25,687
The delivery-to-order ratio of 2.4-to-1 is deeply negative and confirms the cyclical trough. However, the most critical indicator is the rapid evaporation of the industry’s backlog. This backlog, which provides production visibility, has fallen 25% from the start of the year. At the current Q3 delivery rate of 7,255 cars, the entire industry backlog now represents only 3.5 quarters of production visibility. The multi-year cushion that supported manufacturers has vanished.
RSI ARCI North American Railcar Statistics (Q4 2024 – Q3 2025)
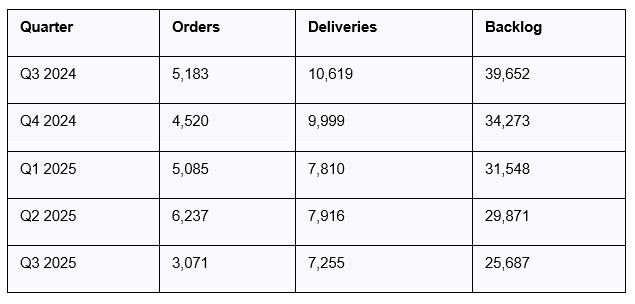
Source: Railway Supply Institute (RSI) -PFL Analytics
Furthermore, industry expectations for a sharp V-shaped recovery appear misplaced. The 50,000-55,000 unit recovery mentioned in the draft is an optimistic outlier. Analysis from industry expert Richard Kloster provided a more sober forecast:
- 2025 Forecast: A build of 38,749 cars.
- 2026-2030 Forecast: An average of 40,516 cars per year.
(This data reframes the mid-term outlook. This is not a new growth cycle. This is a boring, post-COVID normalization to a mature, replacement-level market.)
While the manufacturing segment is in a trough, the railcar leasing and repair market is experiencing exceptional, counter-cyclical strength. The Q3 earnings calls from major lessors confirm this split.
Greenbrier (GBX): As the most manufacturing-heavy of the group, GBX reported results that missed both revenue and earnings-per-share (EPS) expectations. Management explicitly cited subdued demand for new railcars as the primary driver.
Trinity (TRN): Trinity, which has a more balanced model, also missed on revenue. However, management pointed to ongoing strength in the leasing segment, high fleet utilization and lease renewal rates, and strong market dynamics as the saving grace.
GATX: As the leasing-pure-play, GATX’s results show the true strength of the market. The company reported that its North American fleet utilization was 98.9% at the end of Q3. More critically, its renewal success rate was 87.1%, and the renewal lease rate, as measured by its Lease Price Index (LPI), was an explosive +22.8%. Management also confirmed the secondary market for lease-attached railcars remains very strong.
The leasing market’s strength is a direct consequence of the manufacturing market’s weakness. As noted by Trinity’s CEO on the Q3 call, “industry uncertainty is delaying customer orders for new railcars.” In an environment of high interest rates, uncertain demand, and tariff risk, shippers and investors are rationally choosing to pay a significant premium for short-to-medium-term capacity (leases) rather than commit 30-year capital (new builds). The lessors are capitalizing on the exact same uncertainty that is paralyzing the builders.
We are watching Key Economic Indicators
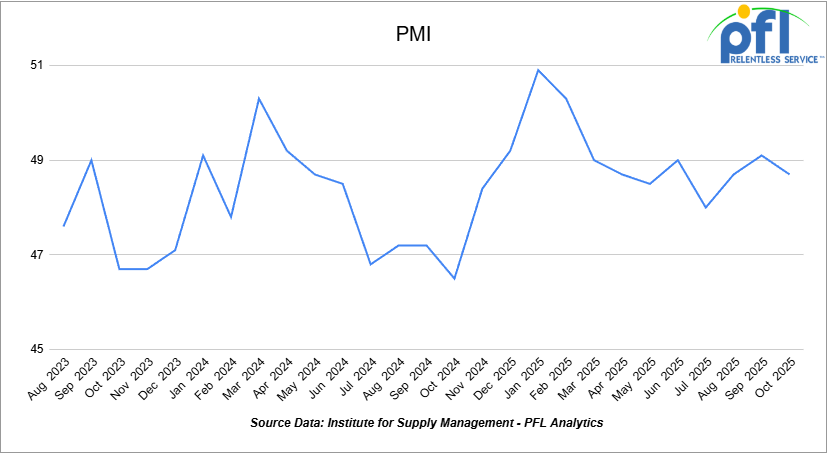
Purchasing Managers Index (PMI)
The Institute for Supply Management releases two PMI reports – one covering manufacturing and the other covering services. These reports are based on surveys of supply managers across the country and track changes in business activity. A reading above 50% on the index indicates expansion, while a reading below 50% signifies contraction, with a faster pace of change, the farther the reading is from 50.
The Manufacturing PMI in October was 48.7%, down from 49.1% in September. This is still in contraction territory, marking the eighth straight month below 50%. On the Services PMI side, the most recent reading is 52.4%, up from 50% in September, signaling continued expansion in the services sector.
Lease Bids
- 30-50, 6000cf Steel Hopper located off of CSX or NS in East. For use in petcoke service. Period: 5 Years.
- 50, 5000CF Covered Hopper located off of UP or BN in Houston. For use in Fertilizer service. Period: 6 Months. Needed ASAP.
- 10, 2500CF Open Top Hopper located off of UP or BN in Texas. For use in aggregate service. Period: 5 years. Need Rapid Discharge Doors.
- 10, 25.5K Any Type Tank located off of CSX in Florida. For use in UCO service. Period: 2 Years.
- 15-20, 29K 117R Tank located off of NS or CSX in Ohio. For use in Ply Oil service. Period: 6-12 Months.
- 10, 30K 117R or 117J Tank located off of Any Class 1 in USA. For use in Glycerin service. Period: 1 year.
- 50, 23.5-25.5 DOT111 Tank located off of Any Class 1 in USA. For use in Asphalt service. Period: 5 years.
- 50-100, 33K 117J Tank located off of BN or UP in Bellview. For use in Butane/ service. Period: Sept-March.
- 4, 30K 117J Tank located off of Any Class 1 in Michigan. For use in Food Grade Ethanol service. Period: Multi year.
- 100, 21.9K 117J Tank located off of All Class 1s in Midwest. For use in CO2 service. Period: 6 months.
- 20, 25.5K Any Type Tank located off of UP in Point Comfort, TX. For use in Diethylene Glycol service. Period: 3-5 Years. No Lining Required.
- 100, 33K Pressure Tank located off of CN or CP in Canada. For use in Propane service. Period: Winter.
- 30-50, 30K Tank 117J located off of NS or CSX in Northeast. For use in C5 service. Period: 1 year.
Sales Bids
- 28, 3400CF Covered Hopper located off of UP BN in Texas. For use in Cement service.Cement Gates needed..
- 20, 17K Tank DOT111 located off of various class 1s in various locations. For use in corn syrup service.
- 120, Various Gondola Open-Top Aluminum Rotary located off of various class 1s in various locations. For use in Sulphur service.Built 2004 or later.
Lease Offers
- 60, 4750 Covered Hoppers located off of UP or BN in Eads, CO. Last used in Grain. Cars are currently clean. UP to 5 Years, 3 Hopper, Gravity Gate, Trough Hatches.
- 100, 6250 Covered Hoppers located off of UP in US. Last used in DDG. 1 Year term. Dirty to Dirty. Free move on UP..
- 25, 19.6K DOT111 Tanks located off of UP in US. Last used in Molases.
- 50, 20K DOT111 Tanks located off of UP or BN in Wichita Falls, TX. Last used in HCL.
- 50, 30K 117R Tanks located off of CSX, NS, or CN in Detroit. Last used in Diesel. Multiyear.
- 50, 20K 117J Tanks located off of All Class 1s in Multiple Locations. Last used in Styrene. Cars are currently moving.
- 22, 25.5K DOT111 Tanks located off of UP in Texas. Last used in Asphalt.
- 29, 25.5K 117J Tanks located off of BN or UP in Texas. Cars are currently clean.
- 40, 30K 117J Tanks located off of BNSF or UP in Houston. Cars are currently clean.
- 50, 5380 Covered Hoppers located off of BNSF or UP in Houston. Cars are currently clean. Available until Feburary.
- 21, 6351 Covered Hoppers located off of CN in Wisconsin. Last used in DDG. Available until February 2027.
- 29, 6500 Covered Hoppers located off of CN in Wisconsin. Last used in DDG. Available until February 2027.
- 100, 30K CPC1232 Tanks located off of UP or BN in Texas. Last used in Diesel.
- 100, 30K DOT117J Tanks located off of UP or BN in Texas. Last used in Gasoline.
- 100, 29K DOT117J Tanks located off of UP or BN in Texas. Last used in Gasoline. Coiled and Insulated.
Sales Offers
- 21, 50′ Boxcar Plate Cs located off of various class 1s in NM. End of Life.
- 3, 50′ Boxcar Plate Cs located off of various class 1s in multiple locations. End of Life.
- 27, 50′ Boxcar Plate Cs located off of various class 1s in PQ. End of Life.
- 100, 3250 Covered Hoppers located off of various class 1s in multiple locations. Sand Cars.
- 5, 2740 Mill Gondolas located off of various class 1s in NC. End of Life.
- 1, 2260 Mill Gondolas located off of various class 1s in AL. End of Life.
- 30, 2740 Mill Gondolas located off of various class 1s in multiple locations. End of Life.
- 21, 2740 Mill Gondolas located off of various class 1s in WA. End of Life.
- 9, 4750 Covered Hoppers located off of various class 1s in multiple locations. End of Life.
- 5, 4750 Covered Hoppers located off of various class 1s in multiple locations. End of Life.
- 50, 31.8K Tank CPC 1232s located off of UP or BN in TX. Requal Due in 2025.
- 100, 4600CF Open Top Hoppers located off of BN or CSX in Southeast.
Call PFL today to discuss your needs and our availability and market reach. Whether you are looking to lease cars, lease out cars, buy cars, or sell cars call PFL today at 239-390-2885
Live Railcar Markets
| CAT | Type | Capacity | GRL | QTY | LOC | Class | Prev. Use | Offer | Note |
|---|
PFL will be at the Following Conferences

- Where: Loews Arlington Hotel
- Attending: Brian Baker (239.297.4519), David Cohen (954-729-4774), and Curtis Chandler (239-405-3365)
- Conference Website

- Where: The Westin Galleria Dallas
- Attending: David Cohen (954-729-4774), and Curtis Chandler (239-405-3365)
- Conference Website

- Where: The Westin Galleria Dallas
- Attending: Brian Baker (239.297.4519)
- Conference Website