
“When you are in the final days of your life, what will you want? Will you hug that college degree in the walnut frame? Will you ask to be carried to the garage so you can sit in your car? Will you find comfort in rereading your financial statement? Of course not. What will matter then will be people. If relationships will matter most then, shouldn’t they matter most now?”
– Max Lucado
Jobs Update
- Initial jobless claims seasonally adjusted for the week ending July 19, 2025 came in at 217,000, down 4,000 people week over week.
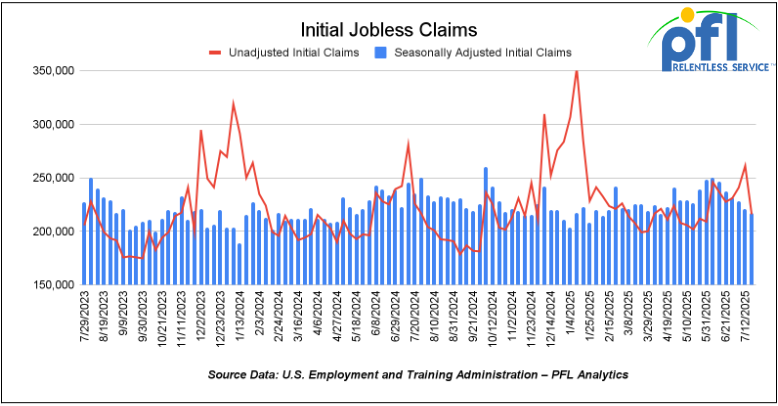
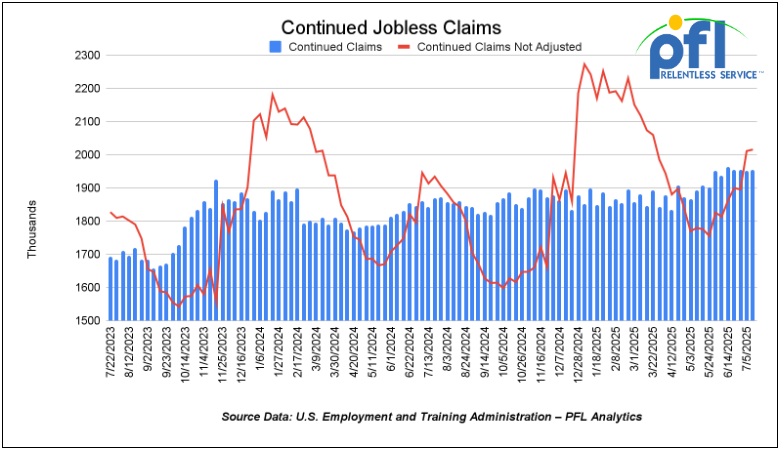
- Continuing jobless claims came in at 1,955,000, versus the adjusted number of 1,951,000 people from the week prior, up 4,000 week-over-week.
Stocks closed higher on Friday of last week and higher week-over-week
The DOW closed higher on Friday of last week, up 208.01 points (0.47%), closing out the week at 44,901.92, up 559.73 points week-over-week. The S&P 500 closed higher on Friday of last week, up 25.29 points (0.40%), and closed out the week at 6,388.64, up 91.85 points week-over-week. The NASDAQ closed higher on Friday of last week, up 50.36 points (0.24%), and closed out the week at 21,108.32, up 213.32 points week-over-week.
In overnight trading, DOW futures traded lower and are expected to open at 45,152 this morning up 68 points from Friday’s close.
Crude oil closed lower on Friday of last week and lower week-over-week
West Texas Intermediate (WTI) crude closed down -0.87 per barrel (-1.3%), to close at $65.16 on Friday of last week, and down $-2.18 week-over-week. Brent crude closed down -0.74 per barrel (-1.1%), to close at $68.44, and down $-0.84 week-over-week.
One Exchange WCS (Western Canadian Select) for September delivery settled on Friday of last week at US$11.25 below the WTI-CMA (West Texas Intermediate – Calendar Month Average). The implied value was US$53.66 per barrel.
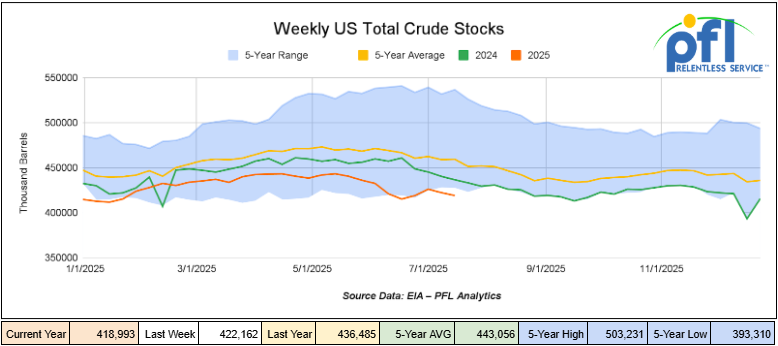
U.S. commercial crude oil inventories (excluding those in the Strategic Petroleum Reserve) decreased by 3.2 million barrels week-over-week. At 419 million barrels, U.S. crude oil inventories are 9% below the five-year average for this time of year.
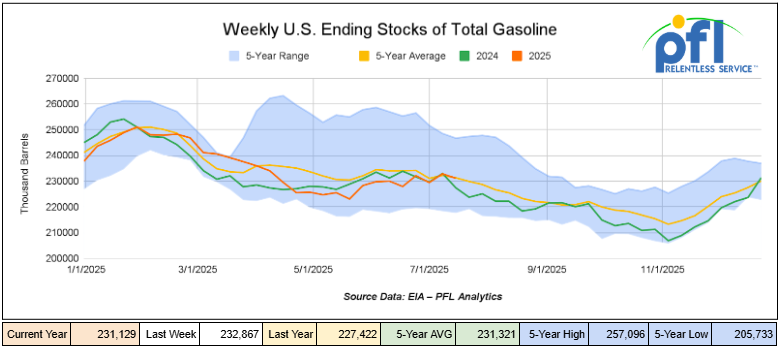
Total motor gasoline inventories decreased by 1.7 million barrels week-over-week and are slightly above the five year average for this time of year.
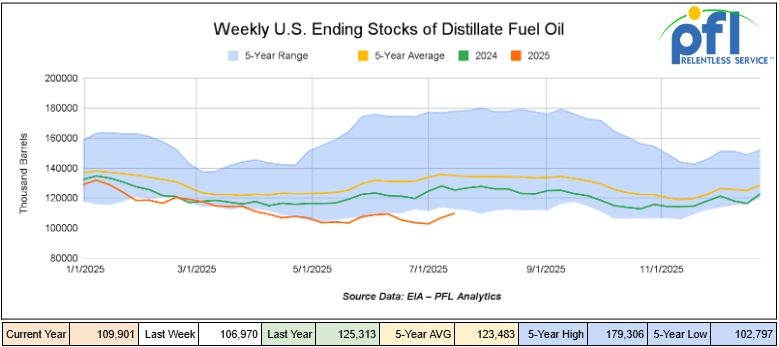
Distillate fuel inventories increased by 2.9 million barrels week-over-week and are 19% below the five year average for this time of year
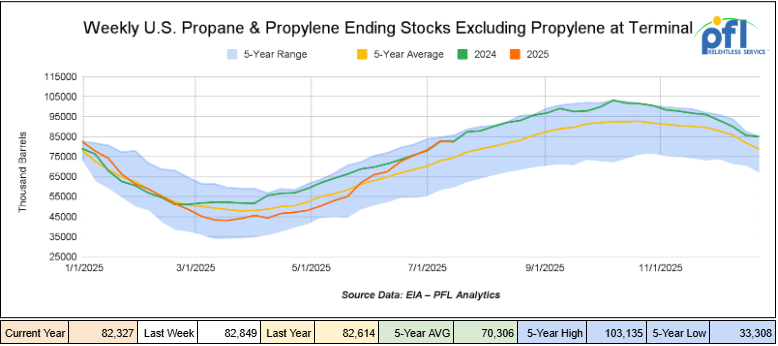
Propane/propylene inventories decreased by 500,000 barrels week-over-week and are 10% above the five year average for this time of year.
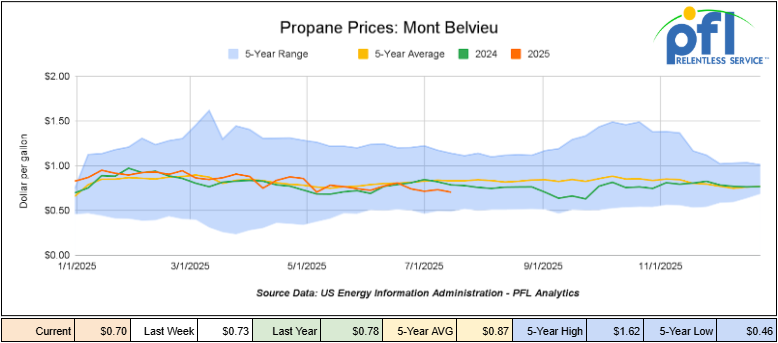
Propane prices closed at 70 cents per gallon on Friday of last week, down 3 cents per gallon week-over-week, and down 8 cents year-over-year.
Overall, total commercial petroleum inventories decreased by 5.2 million barrels during the week ending July 18, 2025.
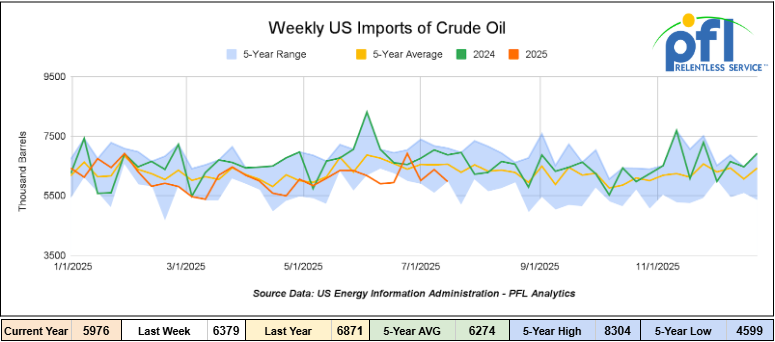
U.S. crude oil imports averaged 6 million barrels per day during the week ending July 18, 2025, a decrease of 403,000 barrels per day week-over-week. Over the past four weeks, crude oil imports averaged 6.3 million barrels per day, 7.1% less than the same four-week period last year. Total motor gasoline imports (including both finished gasoline and gasoline blending components) averaged 606,000 barrels per day, and distillate fuel imports averaged 115,000 barrels per day during the week ending July 18, 2025.
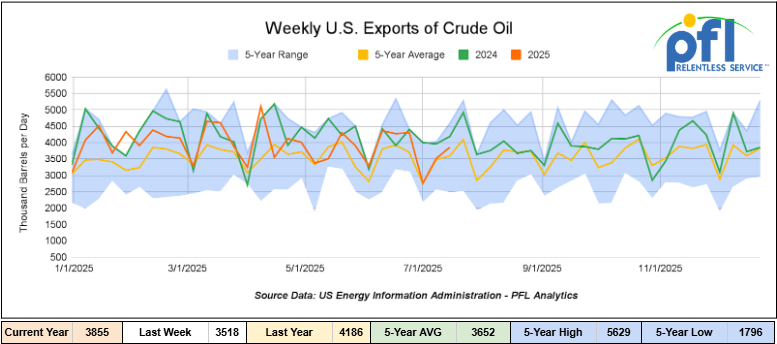
U.S. crude oil exports averaged 3,855 million barrels per day during the week ending July 18, 2025, an increase of 337,000 million barrels per day week-over-week. Over the past four weeks, crude oil exports averaged 3,609 million barrels per day.
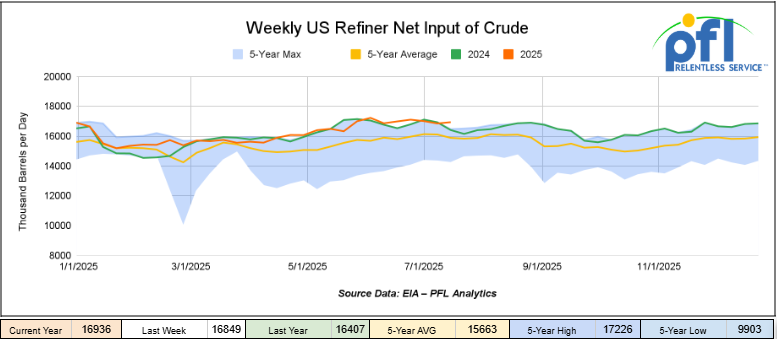
U.S. crude oil refinery inputs averaged 16.9 million barrels per day during the week ending July 18, 2025, which was 87,000 barrels per day more week-over-week.
WTI is poised to open at $65.91, up 75 cents per barrel from Friday’s close.
North American Rail Traffic
Week Ending July 23, 2025:
Total North American weekly rail volumes were up (2.4%) in week 30, compared with the same week last year. Total carloads for the week ending on July 23 were 320,816, up (2.51%) compared with the same week in 2024, while weekly intermodal volume was 334,742, up (2.29%) compared to the same week in 2024.
7 of the AAR’s 11 major traffic categories posted year-over-year increases. The largest decrease came from Forest Products, which was down (-14.99%), while the largest increase was from Grain, which was up (+13.64%).
In the East, CSX’s total volumes were up (2.74%), with the largest decrease coming from Grain (-5.45%), while the largest increase came from Metallic Ores and Metals (+15.13%). NS’s volumes were up (2.18%), with the largest increase coming from Motor Vehicles and Parts (+43.07%), while the largest decrease came from Coal (-9.81%).
In the West, BN’s total volumes were up (5.4%), with the largest increase coming from Grain (+24.24%), while the largest decrease came from Chemicals (-10.91%). UP’s total rail volumes were up (+6.68%), with the largest increase coming from Grain (+33.55%), while the largest decrease came from Other (-4.5%).
In Canada, CN’s total rail volumes were down (-5.67%) with the largest increase coming from Grain (+53.86%) while the largest decrease came from Metallic Ores and Metals (-18.19%). CPKCS’s rail volumes were down (-20.24%), with the largest increase coming from Motor Vehicles and Parts (+38.31%), while the largest decrease came from Forest Products (-67.73%).
As it relates to key commodities, here is what we know:
- Coal: U.S. coal carloads have shown renewed strength, posting their fourth consecutive month of year-over-year gains in June. This continued into July, with coal being a top-three gainer in each of the first three weeks of the month, including a 4,496-carload increase for the week ending July 19. While the AAR notes these gains are partly due to weak comparative figures from 2024, the consistent positive trend signals a stabilization in the sector.
- Grain: U.S. grain carloads surged in mid-July, rising by 4,284 carloads for the week ending July 19. This reflects a broader trend, with June grain carloads up 11.3% year-over-year. This strength is largely tied to exports, with USDA data showing a 3.9% increase in tonnage terms through May, driven by strong corn exports that are offsetting declines in soybeans and sorghum.
- Chemicals: After seeing its first year-over-year decline in 22 months in June, the chemicals sector appeared to rebound in July. For the week ending July 12, chemicals were a top-three commodity gainer, increasing by 1,931 carloads to 32,599. As a critical input for manufacturing, sustained recovery in this sector is a positive sign for the industrial economy.
- Metallic Ores and Metals: This category, a key barometer of industrial production and construction activity, was a top-three gainer in two of the last three weeks. It rose by 1,781 carloads for the week ending July 19 and by 1,853 carloads for the week ending July 5, indicating solid demand.
- Industrial Products & Economic Indicators: While weekly carloads show strength, the AAR’s broader Freight Rail Index, which smooths out seasonal volatility, actually declined in June, hitting its lowest point in a year due to softness in intermodal traffic. This suggests that while specific commodity sectors are performing well, the overall industrial economy may be facing subdued momentum, a trend that aligns with the prolonged contractionary readings from the Manufacturing PMI.
Source Data: AAR – PFL Analytics
Rig Count
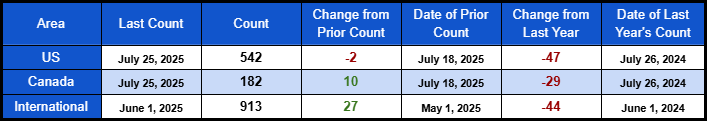
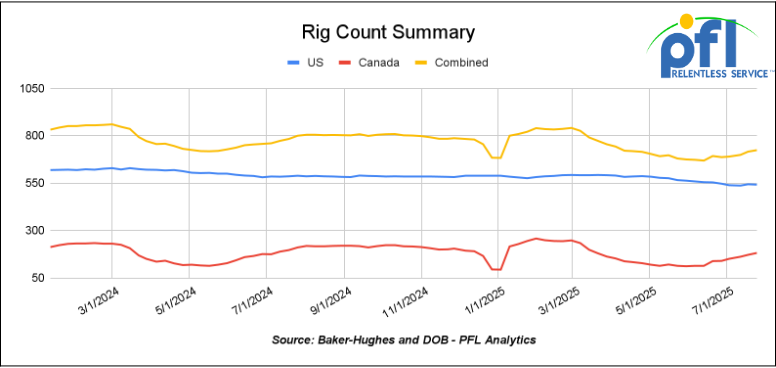
North American rig count was up by 8 rigs week-over-week. The U.S. rig count was down by -2 rigs week-over-week, and down by -47 rigs year-over-year. The U.S. currently has 542 active rigs. Canada’s rig count was up 10 rigs week-over-week, but down by -20 rigs year-over-year. Canada currently has 182 active rigs. Overall, year-over-year we are down by -76 rigs collectively.
North American Rig Count Summary
We are watching a few things out there for you:
We are watching Petroleum Carloads
The four-week rolling average of petroleum carloads carried on the six largest North American railroads fell to 27,854 from 27,931 which was a decrease of -77 rail cars week-over-week. Canadian volumes were mixed. CPCK’s shipments were lower by -4.0% week over week, CN’s volumes were higher by +11.0% week-over-week. U.S. shipments were also mixed. The CSX had the largest percentage increase and was up by +8.0%. The UP was the sole decliner and was down by -5%.
We are watching Canadian Crude by Rail
Crude by rail out of Canada decreased month over month. The Canadian Energy regulator reported late evening on July 23, that 67,686 barrels were exported per day during the month of May 2025, down from 76,866 barrels in April of 2025, a decrease of 9,180 barrels per day, month over month.

Crude by rail will always be necessary out of Canada for stranded oil not connected by pipelines and raw bitumen shipped as a non-haz product which is not able to flow in pipelines and is competitive with pipeline tolls is a growing market to keep an eye on. Other factors would be existing long-term contractual commitments and basis -we really need to see basis WTI-CMA (West Texas Intermediate – Calendar Month Average) blow out to -17 per barrel for sustained periods of time to make economic sense. That may come sooner than we think as Canadian producers are resilient and we are seeing more production than anticipated and pipelines are getting fuller sooner than expected. In the short term – there has been quite a few turnarounds, wild fires and maintenance that has limited production. Stay tuned to PFL for further details.
We are watching the Class 1’s Earnings and Performance
The second-quarter 2025 earnings season has revealed a significant divergence in the performance and outlook of the major Class 1 railroads. Union Pacific demonstrated strong operational and financial momentum, while CSX faced headwinds and Canadian National tempered its expectations for the remainder of the year. See below Q2 performance.
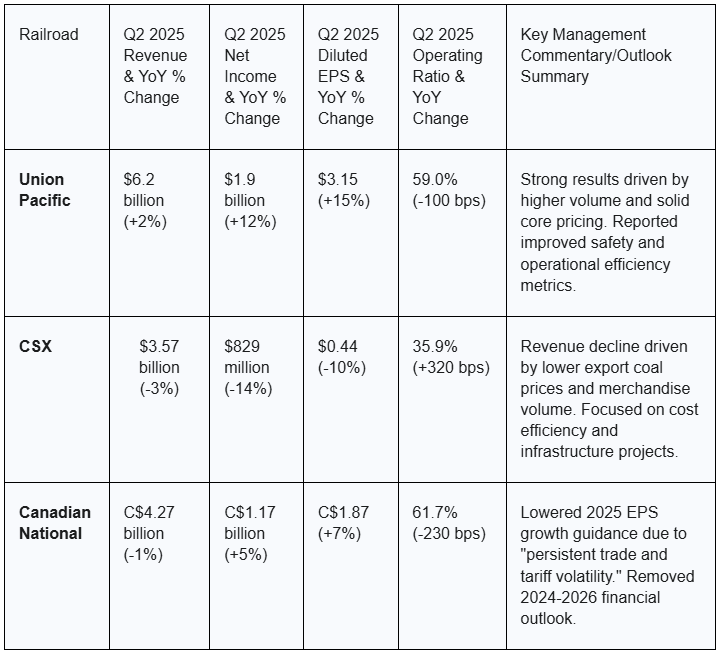
Note: CSX’s operating ratio is not directly comparable to UP’s and CN’s due to different calculation methodologies, but the year-over-year change indicates a decline in efficiency.
Beyond the headline numbers, the operational data reveals the source of this performance gap. Union Pacific reported significant efficiency gains, with freight car velocity improving 10% and locomotive productivity up 5%. In contrast, CSX’s operational metrics moved in the opposite direction, with train velocity decreasing by 4% and dwell time increasing by 2%, signaling network fluidity challenges. This highlights that in the current environment, operational execution is a key differentiator in financial success.
We are watching BNSF and CSX as Class 1 Rail Consolidation Heats Up
Union Pacific and Norfolk Southern have confirmed they’re in active merger talks, with plans to create the first coast-to-coast Class I rail network in U.S. history. That’s kicked off a wave of strategic maneuvering, and all eyes are now on BNSF. Reports indicate that BNSF has brought in outside advisers to explore merger options of its own, potentially targeting a combination with CSX. CSX, for its part, is said to be reviewing its strategic position, suggesting that a second major rail merger could be in play. Despite public denials from BNSF’s parent company, the industry isn’t buying the silence, and for good reason.
Why It Matters:
This isn’t just headline noise. If even one of these mergers goes through, the consequences for rail operations, routing, and commercial structure will be significant.
- Reduced competition: Fewer Class 1’s means fewer pricing options and more concentrated power in fewer hands.
- Disruption risk: Major integrations nearly always result in service hiccups. Interchanges, crew bases, and yards could see pressure, particularly in chokepoints like Chicago, Memphis, and Kansas City.
- New lane dynamics: A UP–NS merger could alter eastbound and southeast service patterns. A BNSF–CSX combo could shift traffic flows and interchange dependencies across the Midwest and Atlantic regions.
- Regulatory roadblocks: The Surface Transportation Board has begun preparing for in-depth reviews. Under post-2001 merger rules, carriers will have to prove that any consolidation benefits the public — not just shareholders.
What We Know (So Far):
- UP and NS leadership are in direct talks, with both sides confirming discussions are underway.
- BNSF is reportedly exploring options with outside advisers, though company leadership denies it.
- CSX is actively assessing its next move, signaling it won’t sit on the sidelines.
- STB is already staffing up, bringing in external rail and shipper experts in anticipation of formal filings.
- Market signals show real movement — with Class I stock prices responding to merger speculation and analyst upgrades.
What to Watch This Week:
- Earnings calls from UP, NS, and CSX may provide more clarity or signal deal readiness.
- Shipper sentiment will matter. Expect public comment windows and industry feedback to play a big role if merger applications hit the STB.
- Commercial adjustments: Some rail customers are already re-evaluating routings, SIT capacity, and contract language as a hedge against volatility.
Bottom Line:
Class I railroads are positioning for a new era of consolidation which means changes are coming to the way freight moves in North America. Shippers, transload operators, and rail service providers should be preparing now. If your network touches multiple Class I’s,especially across east-west corridors, this is the time to assess exposure, capacity pinch points, and the potential for service reshuffling. We’ll continue tracking developments as they unfold.
While UP and NS contemplate a full merger, a different competitive strategy is already in motion. Officially launched on December 1, 2024, the Southeast Mexico Express (SMX) is a freight corridor collaboration between CPKC and CSX connecting Mexico, Texas, and the U.S. Southeast. This tactical alliance is designed to compete directly on the lucrative cross-border trade lane by leveraging CPKC’s direct rail access into Mexico and CSX’s dense network in the U.S. Southeast.
The SMX corridor represents both a defensive and offensive move. It allows CSX to offer a competitive service to counter the threat of a combined UP-NS network, and it gives CPKC a vital partner to extend its reach into the U.S. Southeast, a region its own network does not serve. The service has gained early credibility, with major multimodal providers like Schneider National already using the corridor and reporting high efficiency and reliability. This alliance demonstrates that partnerships can be a potent, flexible, and faster alternative to full-scale mergers for expanding network reach and responding to market consolidation.
We are watching the Railcar & Equipment Market
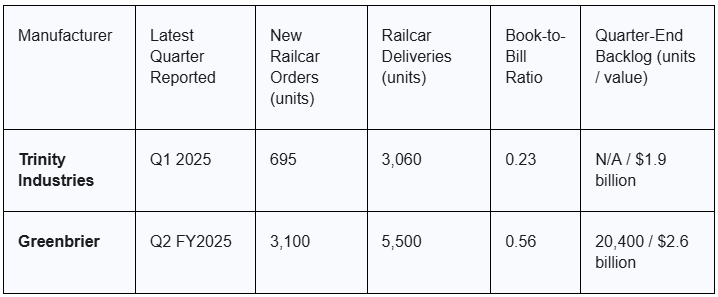
The market for new railcars is showing clear signs of a cyclical slowdown, driven by economic uncertainty and tariff-related delays. Both of the major North American railcar manufacturers reported that deliveries outpaced new orders in their most recent quarters, leading to shrinking backlogs.
- Trinity Industries (TRN): In Q1 2025, Trinity delivered 3,060 railcars but received new orders for only 695. Consequently, its backlog fell from $2.1 billion to $1.9 billion. Management’s forecast for industry-wide deliveries in 2025 is between 28,000 and 35,000 railcars, which would represent a decline of approximately 20% from 2024 levels.
- Greenbrier (GBX): For its second fiscal quarter of 2025, Greenbrier delivered 5,500 units against new orders for 3,100 units. Its new railcar backlog stood at 20,400 units valued at $2.6 billion. Citing “economic uncertainty” and challenging “market conditions,” Greenbrier cut its full-year revenue guidance and announced the closure of a manufacturing facility in Romania.
The following table quantifies the softening demand and highlights the book-to-bill ratio—a key indicator of future manufacturing activity—which is below 1.0 for both companies.
In stark contrast to the slumping manufacturing sector, the railcar leasing market remains robust. This divergence is a clear indicator of widespread economic uncertainty, as companies opt for the flexibility of short-term operating expenses (leases) over making long-term capital expenditures (new car purchases). This is a classic defensive posture in the face of potential volatility from tariffs and trade disputes.
Demand for existing railcars is strong! Trinity reported a high lease fleet utilization of 96.8% and a very strong Future Lease Rate Differential (FLRD) of positive 17.9%, indicating that expiring leases are being renewed at significantly higher rates. Greenbrier’s fleet utilization is also a healthy 98%.
Looking forward, the overall North American railcar leasing market is projected to grow by $8.3 billion between 2025 and 2029, accelerating at a compound annual growth rate (CAGR) of 9.1%. This growth is being driven by continued demand for tank cars for crude oil, renewable diesel feed stocks and chemical transport, as well as the adoption of technologies like IoT and telematics for advanced fleet management.
A significant legislative development with the potential to reshape railcar investment strategy occurred on July 4, 2025, with the signing of the “One Big Beautiful Bill Act” (OBBBA). The most impactful provision for the equipment market is the permanent restoration of 100% bonus depreciation for qualified property acquired and placed in service after January 19, 2025. This reverses the scheduled phase-down under the Tax Cuts and Jobs Act (TCJA), which would have limited the first-year deduction to just 40% in 2025.
This change is expected to spur activity in railcar purchasing. The ability to immediately deduct the full cost of qualifying assets, including new and used railcars and other heavy machinery, provides a powerful incentive for capital investment. For businesses looking to acquire equipment, this allows for accelerated cost recovery, improved cash flow, and reduced tax liability in the year of purchase.
The legislation also has profound implications for the railcar financing and leasing sector. Historically, tax benefits like bonus depreciation have been a crucial value driver, with lessors passing the value of the tax deduction on to customers in the form of lower lease rates. The restoration of 100% bonus depreciation could make direct purchasing more attractive than leasing for some end-users. However, it also creates a significant opportunity for railcar finance and leasing companies that have the tax capacity to absorb large depreciation deductions. These firms may become more active in the market, leveraging the tax shield to pay more for equipment, particularly in sale-leaseback transactions where the benefit can be fully monetized. The impact may be uneven, as some large investors in rail equipment, such as private equity firms, are not traditional taxpayers and may be unable to fully utilize the depreciation benefits. Additionally, businesses must consider that many states do not conform to federal bonus depreciation rules, requiring separate state-level tax planning.
We are watching the Rail Risk Landscape.
The Railway Safety Act:
The Railway Safety Act of 2025, a bipartisan bill introduced in February 2025 in response to the East Palestine, Ohio, derailment, remains stalled in the House Transportation and Infrastructure Committee. Cleanup and health monitoring from that 2023 incident are still ongoing as of July 2025.
The proposed legislation includes several key provisions aimed at enhancing safety. It would mandate the use of wayside defect detectors, establish minimum crew sizes (generally two people), significantly increase fines for safety violations, and require the phase-out of older, less-safe tank car models. The bill also calls for the Department of Transportation to establish new rules governing train length and weight, track maintenance standards, and minimum time requirements for railcar inspections. The rail industry, through the AAR, has pushed back on certain provisions, notably lobbying for a waiver to reduce the frequency of visual track inspections in favor of a blend with automated technology—a move critics argue is a cost-cutting measure that could compromise safety.
Cybersecurity Red Alert:
A critical, systemic risk to the entire North American rail network was made public on July 10, 2025, with the disclosure of a high-severity cybersecurity vulnerability, tracked as CVE-2025-1727. The flaw resides in the radio-frequency protocol that links a locomotive’s head-of-train (HoT) device with the end-of-train (EoT) device, which controls the brakes on the rear of the train. The protocol lacks any modern cryptographic authentication, relying instead on a simple checksum that can be easily forged.
The threat is alarmingly practical. An attacker with inexpensive, off-the-shelf software-defined radio equipment (costing less than $600) and physical proximity to a train could broadcast malicious commands to the EoT device, triggering a sudden emergency stop. Such an event could potentially lead to a catastrophic derailment or a complete brake system failure.
This vulnerability represents a fundamental flaw in the protocol’s design, not a simple software bug that can be patched. The flaw has reportedly been known to security researchers for over a decade. The AAR is pursuing the development of a new, secure protocol, but it is not expected to be ready for fleet-wide deployment until 2027 at the earliest. This slow-moving, multi-year plan to address a flaw that enables the potential remote derailment of any train highlights a dangerous gap between the pace of technological risk and the rail industry’s institutional response capability.
Operational Incidents:
Operational reliability and safety remain key areas of focus. On July 25, 2025, a CN freight train derailed in Paris, Ontario, involving approximately 24 railcars and one locomotive. While the derailment was “upright” with no reported injuries or spills, its location on a bridge over a main road caused a complete halt to rail traffic in the area and led to significant disruptions and cancellations for VIA Rail passenger services. The Transportation Safety Board of Canada has deployed a team to investigate the cause.
The risks posed by severe weather were starkly illustrated in late June when a powerful derecho swept across North Dakota, causing three separate derailments. The storm system included an EF-3 tornado that derailed a CPKC train near Enderlin, while high winds also derailed a 43-car BNSF empty coal train near Steele and several BNSF grain cars near Mayville. This cluster of incidents highlights the vulnerability of rail networks to increasingly extreme weather events.
Beyond major derailments, daily operational friction persists. The Federal Railroad Administration’s public portal for blocked crossings continues to log numerous daily incidents of stationary trains blocking public roads for extended periods, impacting community mobility and the response times of emergency services. Passenger rail operators, including Amtrak, NJ Transit, and Chicago’s Metra, also report frequent service alerts, delays, and cancellations due to a combination of equipment failures, necessary track work, and other operational issues.
PFL’s Perspective:
The North American rail industry is in a state of high-stakes transformation. The confirmed UP-NS merger talks are the defining event, representing a potential paradigm shift in the sector’s competitive structure. This is not happening in a vacuum; it is a direct reaction to the creation of the CPKC North-South corridor and the broader trend of near-shoring that favors it. The industry is effectively reorganizing itself around new continental trade axes.
This strategic maneuvering is occurring amidst a dangerous paradox. Railroads are posting strong weekly volumes and, in some cases, impressive Q2 results, suggesting a healthy business. Yet, this masks deep anxieties about the future, evidenced by CN’s guidance cut and the industry-wide pullback in capital spending on new railcars.
Simultaneously, the risk profile of the entire sector has been elevated. The unresolved legislative battle over the Railway Safety Act and the shocking disclosure of the CVE-2025-1727 braking vulnerability demonstrate that the industry’s political, regulatory, and technological foundations are less stable than current profits might suggest.
Strategic Recommendations:
For Shippers: It is imperative to intensively model the potential impacts of a UP-NS merger on network options, service quality, and pricing. Engagement with the STB should begin now to ensure shipper interests are central to any merger review. Diversifying carrier relationships where possible and exploring the flexibility offered by new alliance-based services like the SMX corridor should be a top priority.
For Railroads & Operators: The industry must immediately escalate its response to the CVE-2025-1727 vulnerability. The 2027 timeline for a permanent fix is untenable given the severity of the risk. A transparent communication plan and the rapid deployment of any possible interim mitigations are urgently needed. On the regulatory front, proactive engagement to find a workable compromise on the Railway Safety Act is preferable to the current political and reputational risk posed by the stalemate.
For Investors: Valuations of Class I railroads must be re-evaluated based not just on current earnings but on their strategic positioning within the new consolidating landscape. Portfolios should be heavily discounted for the heightened risk environment, with particular attention paid to cybersecurity preparedness and potential future regulatory costs. The performance divergence between UP and CSX underscores the critical importance of operational execution. In the equipment sector, leasing companies with strong fleet utilization and rate power appear better positioned than manufacturers facing a cyclical downturn in new orders.
Lease Bids
• 30-50, 6000cf Steel Hopper located off of CSX or NS in East. For use in petcoke service. Period: 5 Years.
• 50, 5000CF Covered Hopper located off of UP or BN in Houston. For use in Fertilizer service. Period: 6 Months. Bid: Negotiable.Needed ASAP.
• 10, 2500CF Open Top Hopper located off of UP or BN in Texas. For use in aggregate service. Period: 5 years. Bid: Negotiable.Need Rapid Discharge Doors.
• 20, 25.5k CPC 1232 Tank located off of UP, BN, CSX, NS in OK, TX, Northeast. For use in Asphalt service. Period: 3 Years. Bid: Negotiable.
• 10, 25.5K Any Type Tank located off of CSX in Florida. For use in UCO service. Period: 2 Years. Bid: Negotiable.
• 20, 28.3K 117J Tank located off of BN in Montana. For use in Crude service. Period: 2 years. Bid: Negotiable.
• 20, 30K 117J Tank located off of UP or BN in Midwest. For use in Ethanol service. Period: 5 Years. Bid: Negotiable.
• 15, 29K 117R Tank located off of NS or CSX in Ohio. For use in Ply Oil service. Period: 6-12 Months. Bid: Negotiable.
• 10, 30K 117R or 117J Tank located off of Any Class 1 in USA. For use in Glycerin service. Period: 1 year. Bid: Negotiable.
• 50, 23.5-25.5 DOT111 Tank located off of Any Class 1 in USA. For use in Asphalt service. Period: 5 years. Bid: Negotiable.
• 10, 25.5K Tank Any Type located off of Any Class 1 in Any Location. For use in Asphalt service. Period: 3-12 months. Bid: Negotiable.
• 100, 33K 117J Tank located off of BN or UP in Bellview. For use in Butane/ service. Period: Sept-March. Bid: Negotiable.
• 4, 30K 117J Tank located in Michigan. For use in Food Grade Ethanol service. Period: Multi year. Bid: Negotiable.
• 10-20, 29K Tank CPC 1232 located off of CP in Washington, Iowa. For use in Biodiesel service. Period: 1 Year min. Bid: Negotiable.
• 50, 33K Tank 117J located off of CP or CN in Canada. For use in Propane service. Period: Summer. Bid: Negotiable.
• 6, 4750 Covered Hopper located off of NS in Georgia. For use in Fertilizer service. Period: 3-5 years. Bid: Negotiable.
Sales Bids
• 28, 3400CF located off of UP BN in Texas. For use in Cement service. Bid: Negotiable. Cement Gates needed.
• 20, 17K DOT111 located off of various class 1s in various locations. For use in corn syrup service.
Lease Offers
• 60, 4750 Hoppers located off of UP or BN in Eads, CO. Last used in Grain. Offer: Negotiable. UP to 5 Years, 3 Hopper, Gravity Gate, Trough Hatches.
• 100, 6250 Hoppers located off of UP in US. Last used in DDG. Offer: Negotiable. 1 Year term. Dirty to Dirty. Free move on UP..
• 24, 25.5K-30K Tanks located off of UP or BN in Texas. Last used in Base Oils. Offer: Negotiable. 1-2 Year.
• 25, 19.6K Tanks located off of UP in US. Last used in Molases. Offer: Negotiable.
• 50, 20K Tanks located off of UP or BN in Wichita Falls, TX. Last used in HCL. Offer: Negotiable.
• 50, 30K Tanks located off of CSX, NS, or CN in Detroit. Last used in Diesel. Offer: Negotiable. Multiyear.
• 50, 20K 117J located off of All Class 1s in N/A. Last used in Styrene. Offer: Negotiable. Cars are currently moving.
Sales Offers
• 21, 50′ Boxcar Plate Cs located off of various class 1s in NM. Offer: Negotiable. End of Life.
• 3, 50′ Boxcar Plate Cs located off of various class 1s in multiple locations. Offer: Negotiable. End of Life.
• 27, 50′ Boxcar Plate Cs located off of various class 1s in PQ. Offer: Negotiable. End of Life.
• 100, 3250 Covered Hoppers located off of various class 1s in multiple locations. Offer: Negotiable. Sand Cars.
• 5, 2740 Gondola Mills located off of various class 1s in NC. Offer: Negotiable. End of Life.
• 1, 2260 Gondola Mills located off of various class 1s in AL. Offer: Negotiable. End of Life.
• 30, 2740 Gondola Mills located off of various class 1s in multiple locations. Offer: Negotiable. End of Life.
• 21, 2740 Gondola Mills located off of various class 1s in WA. Offer: Negotiable. End of Life.
• 9, 4750 Covered Hopper N/As located off of various class 1s in multiple locations. Offer: Negotiable. End of Life.
• 5, 4750 Covered Hopper N/As located off of various class 1s in multiple locations. Offer: Negotiable. End of Life.
• 50, 31.8K Tank CPC 1232s located off of UP or BN in TX. Offer: Negotiable. Requal Due in 2025.
Call PFL today to discuss your needs and our availability and market reach. Whether you are looking to lease cars, lease out cars, buy cars, or sell cars call PFL today at 239-390-2885
Live Railcar Markets
| CAT | Type | Capacity | GRL | QTY | LOC | Class | Prev. Use | Offer | Note |
|---|
PFL will be at the Following Conferences

- Where: Calgary
- Attending: David Cohen (954-729-4774), Curtis Chandler(239-405-3365), Cyndi Popov (403-402-5043)

- Where: Grand Geneva Resort
- Attending: Brian Baker (239.297.4519)
- Conference Website

- Where: Loews Arlington Hotel
- Attending: Brian Baker (239.297.4519), David Cohen (954-729-4774), and Curtis Chandler (239-405-3365)
- Conference Website

- Where: The Westin Galleria Dallas
- Attending: David Cohen (954-729-4774), and Curtis Chandler (239-405-3365)
- Conference Website

- Where: The Westin Galleria Dallas
- Attending: Brian Baker (239.297.4519)
- Conference Website