
“I had to live in the desert before I could understand the full value of grass in a green ditch.”
– Ella Maillart
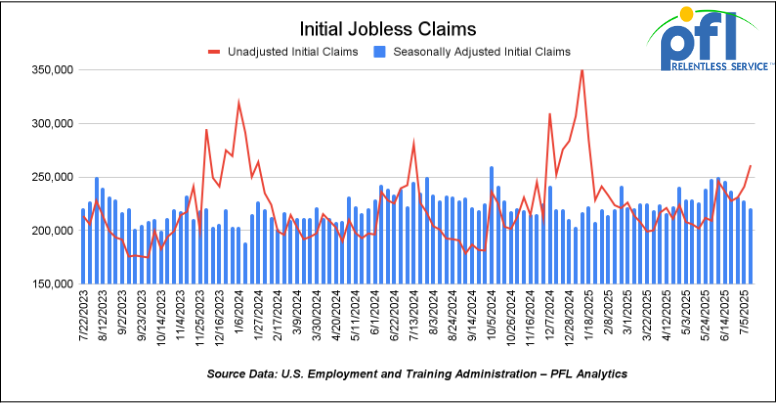
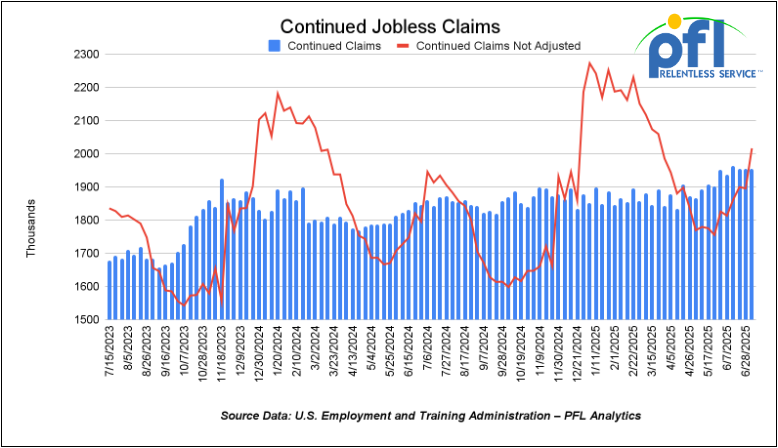
Jobs Update
- Initial jobless claims seasonally adjusted for the week ending July 12 came in at 221,000, down 7,000 people week over week week-over-week.
- Continuing jobless claims came in at 1.956 million people, versus the adjusted number of 1.954 million people from the week prior, up 2,000 week-over-week.
Stocks closed mixed on Friday of last week and mixed week-over-week
The DOW closed lower on Friday of last week, down -142.3 points (-0.32%), closing out the week at 44,342.19, down -29.32 points week-over-week. The S&P 500 closed lower on Friday of last week, down 0.57 points, and closed out the week at 6,296.79, higher 37.04 points week-over-week. The NASDAQ closed higher on Friday of last week, up 10.01 points, and closed out the week at 20,895.66, up 310.14 points week-over-week.
In overnight trading, DOW futures traded higher and are expected to open at 44,648 this morning up 108 points from Friday’s close.
Crude oil closed lower on Friday of last week and lower week-over-week.
West Texas Intermediate (WTI) crude closed down 24 cents per barrel (-0.3%), to close at $67.34 per barrel on Friday of last week, and down $1.11 per barrel week-over-week. Brent crude closed down 20 cents USD per barrel (-0.2%) on Friday of last week, to close at $69.28 per barrel, down $1.08 per barrel week-over-week.
One Exchange WCS (Western Canadian Select) for August delivery settled on Friday of last week at US$10.95 below the WTI-CMA (West Texas Intermediate – Calendar Month Average). The implied value was US$54.92 per barrel.
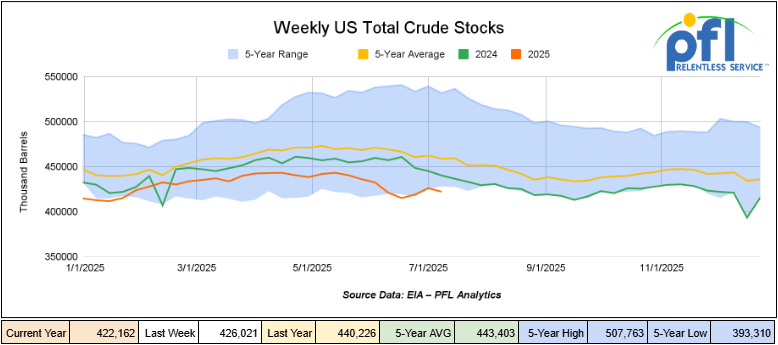
U.S. commercial crude oil inventories (excluding those in the Strategic Petroleum Reserve) a decrease of 3.9 million barrels week-over-week. At 422.2 million barrels, U.S. crude oil inventories are 8% below the five-year average for this time of year.
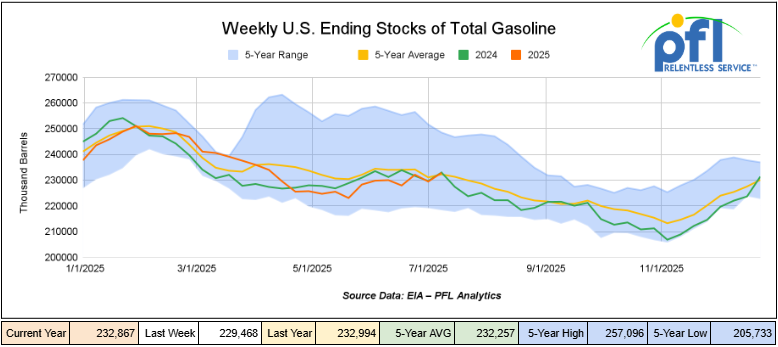
Total motor gasoline inventories increased by 3.4 million barrels week-over-week and are slightly above the five-year average for this time of year.
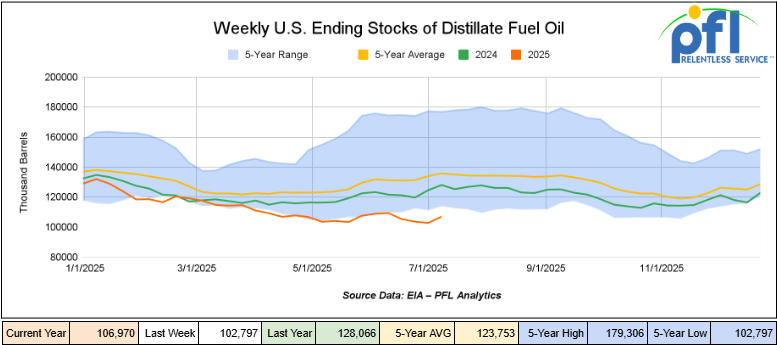
Distillate fuel inventories increased by 4.2 million barrels week-over-week and are 21% below the five-year average for this time of year.
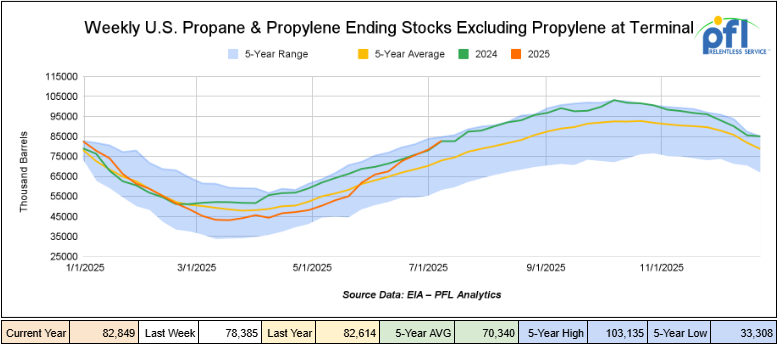
Propane/propylene inventories increased by 4.5 million barrels week-over-week and are 14% above the five-year average for this time of year.
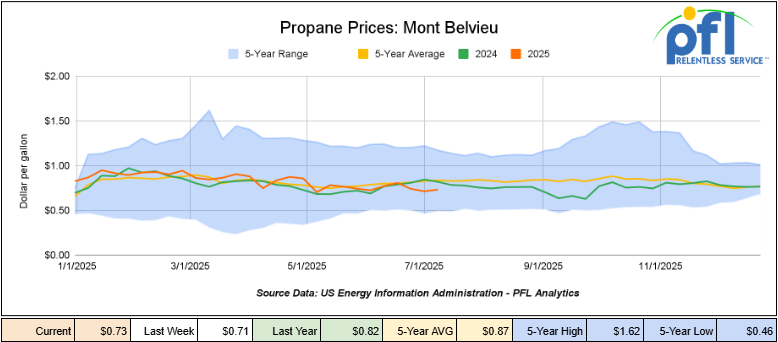
Propane prices closed at 73 cents per gallon on Friday of last week, up 2 cents per gallon week-over-week, and down 9 cents year-over-year.
Overall,total commercial petroleum inventories increased by 9.3 million barrels during the week ending July 11, 2025.
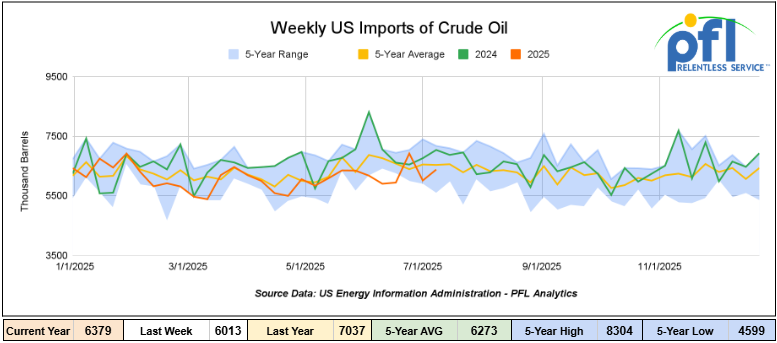
U.S. crude oil imports averaged 6.4 million barrels per day during the week ending June 27, 2025, an increase of 366,000 barrels per day week-over-week. Over the past four weeks, crude oil imports averaged 6.3 million barrels per day, 6.3% less than the same four-week period last year. Total motor gasoline imports (including both finished gasoline and gasoline blending components) averaged 624,000 barrels per day, and distillate fuel imports averaged 146,000 barrels per day during the week ending June 27, 2025.
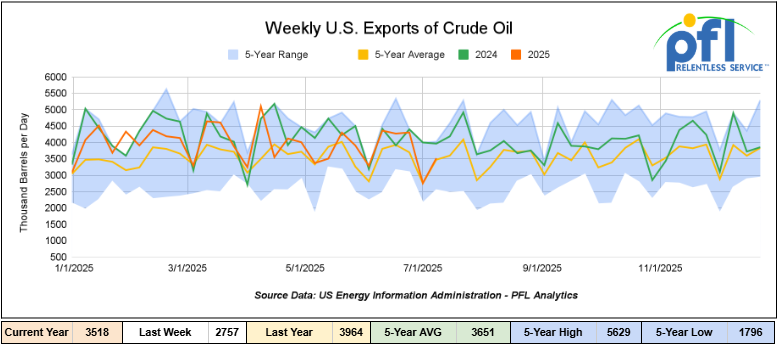
U.S. crude oil exports averaged 3.518 million barrels per day during the week ending July 11, 2025, an increase of 761,000 barrels per day week-over-week. Over the past four weeks, crude oil exports averaged 3.713 million barrels per day.
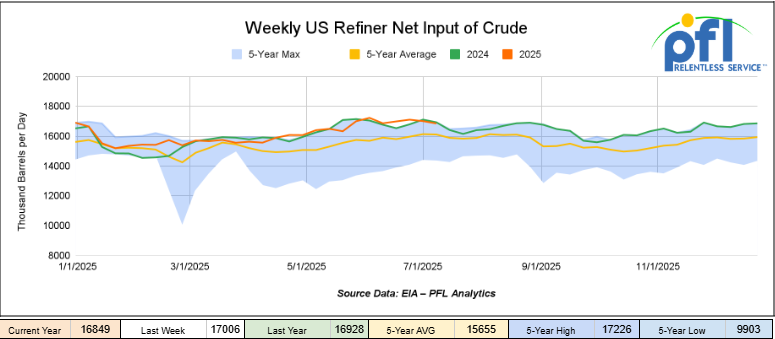
U.S. crude oil refinery inputs averaged 16.8 million barrels per day during the week ending July 11, 2025, which was 158,000 barrels per day less week-over-week.
WTI is poised to open at 65.87, down 18 cents per barrel from Friday’s close.
North American Rail Traffic
Week Ending July 16, 2025:
Total North American weekly rail volumes were down (-0.27%) in week 29, compared with the same week last year. Total carloads for the week ending on July 16 were 317,407, down (-0.03%) compared with the same week in 2024, while weekly intermodal volume was 325,522, down (-0.5%) compared to the same week in 2024.
8 of the AAR’s 11 major traffic categories posted year-over-year increases. The largest decrease came from Forest Products, which was down (-18.21%), while the largest increase was from Other, which was up (+5.92%).
In the East, CSX’s total volumes were up (1.4%), with the largest decrease coming from Grain (-9.2%), while the largest increase came from Intermodals (+5.47%). NS’s volumes were down (-2.05%), with the largest increase coming from Motor Vehicles and Parts (+26.4%), while the largest decrease came from Coal (-14.65%).
In the West, BN’s total volumes were down (-2.26%), with the largest increase coming from Other (+13.18%), while the largest decrease came from Coal (-28.26%). UP’s total rail volumes were up (+9.94%), with the largest increase coming from Coal (+38.28%), while the largest decrease came from Motor Vehicles and Parts (-7.71%).
In Canada, CN’s total rail volumes were down (-9.97%) with the largest increase coming from Grain (+28.01%) while the largest decrease came from Coal (-28.26%). CPKCS’s rail volumes were down (-19.89%), with the largest increase coming from Nonmetallic Minerals (+13.79%), while the largest decrease came from Forest Products (-69.26%).
Source Data: AAR – PFL Analytics
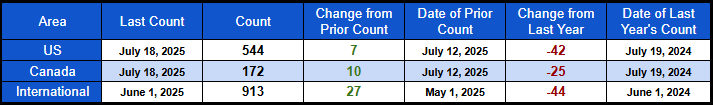
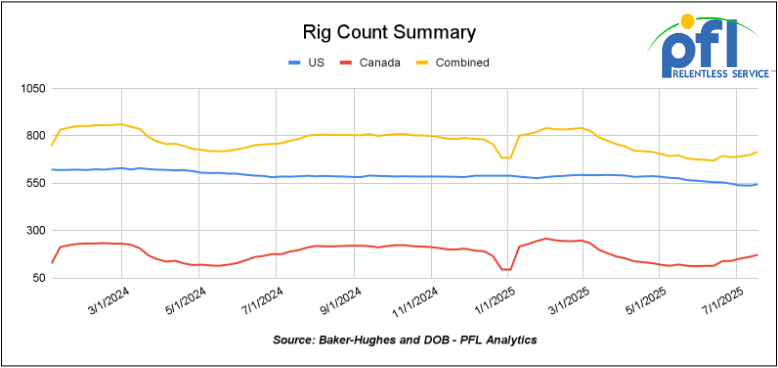
Rig Count
North American rig count was up by 17 rigs week-over-week. The US rig count was up by 7 rigs week-over-week, and down by -42 rigs year-over-year. The US currently has 544 active rigs. Canada’s rig count was up 10 rigs week-over-week, and down by -25 rigs year-over-year. Canada currently has 172 active rigs. Overall, year-over-year, we are down by -67 rigs collectively.
North American Rig Count Summary
We are watching a few things out there for you:
We are watching Petroleum Carloads
The four-week rolling average of petroleum carloads carried on the six largest North American railroads rose to 27,931 from 27,840 which was an increase of +91 rail cars week-over-week. Canadian volumes were mixed. CN’s shipments were lower by -2.0% week over week, CKPC’s volumes were higher by +17.0% week-over-week. U.S. shipments were mostly higher. The CSX had the largest percentage increase and was up by +17.0%. The NS was the sole decliner and was down by -5%.
We are watching the UP and NS
Union Pacific (UP) and Norfolk Southern (NS) are in early merger talks, as announced last week. If successful, the deal would create North America’s first coast-to-coast rail network—reshaping service, competition, and pricing for shippers.
What’s Driving the Merger:
- Combining UP’s western network with NS’s eastern reach would streamline cross-country freight, reducing hand-offs, especially through Chicago.
- UP projects $4 billion in annual cost savings by eliminating redundancies and improving efficiency.
- The combined carrier would compete more directly with BNSF, CSX, and CPKC for intermodal and premium lanes.
Key Timelines:
- A formal merger filing is expected by mid-2026.
- STB, DOJ, labor unions, and Amtrak will scrutinize the deal under strict 2001 merger rules, which require proof of public benefit.
- Regulatory approval, if granted, wouldn’t likely occur before 2027–2028.
Implications for Rail Shippers:
- Faster, more reliable coast-to-coast transit with fewer interchanges.
- Potential rate advantages from carrier efficiencies, but less competition could push prices up without regulatory safeguards.
- Access concerns for smaller shippers unless reciprocal switching is mandated.
- Short-term service disruptions are common during major integrations.
What Shippers Should Do Now:
- Review rate agreements and service contracts for flexibility.
- Develop contingency plans with alternate routing options.
- Monitor regulatory proceedings and prepare to provide feedback to the STB.
Other Industry Watchpoints:
- STB’s potential to mandate reciprocal switching.
- Labor union reactions could complicate merger execution.
- BNSF, CSX, and CPKC may respond by improving their networks or partnerships.
A merger of this scale would take years to finalize, but proactive planning today will help shippers stay competitive and protected. PFL is monitoring developments closely and can help navigate potential impacts to your supply chain.
We are watching the Big Beautiful Deal – A Win for American Energy, Rail, and Industry
Although the One Big Beautiful Bill Act (“OBBBA”) was signed into law earlier this month, the real impacts are just beginning to take shape. Energy producers, rail operators, and infrastructure developers are actively strategizing to capitalize on the expanded 45Q tax credit, which now pays $85/ton for captured CO₂ used in Enhanced Oil Recovery (EOR) and $180/ton for Direct Air Capture (DAC). PFL has been writing about enhanced oil recovery for years through CO₂ injection into depleting or depleted oil fields. We are so happy to see this could be a reality and are happy to see it put into play – kill two birds with one stone, as they say.
While the bill scaled back broad clean-energy subsidies, it unlocked new market-driven incentives designed to strengthen U.S. energy security, drive private investment, and expand industrial infrastructure—without the weight of new regulations.
Energy and Rail:
- Strengthening U.S. Energy Supply: By linking carbon capture with oil production, OBBBA increases U.S. crude output, reducing reliance on foreign sources and supporting energy independence.
- Opportunities for Rail Freight: Expanding carbon capture infrastructure will create new demand for specialized CO₂ railcars, transloading facilities, and industrial sidings—particularly near the Permian Basin, Gulf Coast, and Midwest.
- Rail and Pipeline Synergy: While pipelines will play a role, rail is essential for bridging regions where pipelines aren’t feasible or face state restrictions, thereby making rail a critical part of the CCUS logistics chain.
- Private Capital, Not Mandates: The 45Q expansion incentivizes innovation and investment from the private sector, ensuring market forces determine the best path forward.
What This Means for Industry:
- Oil Producers: Enhanced revenue potential through EOR projects backed by carbon capture.
- Rail Operators: New revenue streams from CO₂ transport, construction materials, and industrial logistics;
- Manufacturers: Increased demand for railcars, pipe, steel, and related infrastructure.
- Taxpayers: A pay-for-performance model where incentives are only earned when carbon is captured and utilized.
What to Watch:
- State-Level Policy: Pipeline opposition in states like South Dakota could make rail even more critical in CCUS logistics.
- Corporate Leadership: Companies like Occidental Petroleum and ExxonMobil are scaling DAC projects, creating downstream opportunities for transport and supply chains.
- Compliance with Foreign Entity Restrictions: To qualify for credits, projects must navigate these rules, keeping critical infrastructure American-led.
OBBBA represents a balanced approach to advancing energy security, industrial growth, and environmental accountability—benefiting American workers, taxpayers, and industries alike.
For the rail sector, this is a growth market! Railroads, shippers, and industrial operators should start positioning to capture business from the rising demand for CO₂ transportation, materials, and infrastructure expansion.
We are watching the BN and the STB
In a rare public display of operational tension between Class I carriers, BNSF Railway has filed an emergency petition with the Surface Transportation Board seeking immediate trackage rights over a Union Pacific (UP) corridor between Salt Lake City, Utah, and the Los Angeles Basin in California. BNSF alleges that UP has denied it reasonable access and that service disruptions are negatively impacting time-sensitive freight deliveries, particularly in the intermodal sector.
BNSF’s petition argues that the lack of alternate routing options and growing congestion in the western network necessitates STB intervention to avoid cascading delays for customers and to protect network resiliency. The request, if granted, would give BNSF temporary authority to move its trains over UP-owned infrastructure, which is something typically reserved for natural disasters or network emergencies.
Union Pacific has yet to formally respond in detail, but is expected to challenge the petition on both operational and legal grounds. The outcome of this filing will be closely watched, as it could set a precedent for inter-carrier trackage rights during times of network strain.
We are watching Left Wing Canadian Prime Minister Carney
Left-wing Canadian Prime Minister Mark Carney is setting the stage to blame First Nations for delays on Canada’s major infrastructure projects. Behind closed doors, insiders say the government is preparing to shift public focus onto Indigenous opposition – even though left-wing poor policy design is the real issue.
At the heart of the controversy is the Building Canada Act (Bill C-5), a fast-track law for energy, mining, and transportation projects. The legislation was rushed through with minimal consultation, as it should have been. Now, nine First Nations in Ontario are mounting a constitutional challenge, arguing the law sidelines their rights and proper consultation.
Carney recently met with First Nations leaders in Gatineau, promising to “listen.” But, as legal challenges and project delays are sure to mount, Ottawa is expected to pivot—blaming Indigenous resistance for holding back the economy. Why blame yourself‽
Bill C-5 grants Ottawa broad powers to bypass environmental reviews and Indigenous consultation in the name of “national interest.” If you ask us what is wrong with that, enough is enough! There have been so many projects under this so-called “environmental review” for years in Canada already.
Leaders like Chief Cindy Woodhouse Nepinak have made it clear: this isn’t consultation—it’s a power grab. And, if the government won’t correct course, protests and blockades could return.
Court rulings on the constitutionality of Bill C-5 could take time. Meanwhile, Carney’s government will likely push the narrative that First Nations are stalling national progress – while Indigenous leaders prepare to escalate resistance. Stay tuned to PFL, we are watching this one closely.
We are watching China
In the latest, a brewing global standoff could reshape the flow of freight into North America. China is threatening to block the $22.8 billion sale of 43 global port terminals, including strategic assets near the Panama Canal, unless state-owned COSCO gets a piece of the deal.
The terminals, which are owned by CK Hutchison, are now in exclusive sale talks with a BlackRock–MSC consortium which is set to expire July 27.
If China follows through, the ownership of critical global gateways could remain up in the air—creating ripple effects across the rail freight sector.
Control the Ports, Control the Supply Chain:
- The Panama Canal remains a key artery for U.S.-bound container freight, especially for the Gulf Coast and East Coast ports that railroads like CSX, NS, and UP connect to inland markets.
- If the deal is blocked or delayed, uncertainty in terminal ownership could disrupt established container flows, complicating rail scheduling, pricing, and equipment positioning.
- With COSCO’s potential involvement, geopolitical tensions will escalate, increasing U.S. scrutiny and potentially limiting port access or investments tied to Chinese interests.
Rail’s Infrastructure Opportunity – or Stall:
- A completed sale to BlackRock–MSC could trigger immediate investments in port infrastructure—new sidings, expanded intermodal yards, and capacity upgrades that benefit rail
- If the sale stalls or gets restructured to accommodate COSCO, infrastructure upgrades may stall, leaving North American railroads and shippers waiting for capacity that doesn’t materialize.
- Shippers relying on Panama Canal-fed ports may need to diversify routings to ports like Houston, Mobile, or even Mexican ports to hedge against uncertainty.
Politics in Play — and Rail Can’t Ignore It:
- U.S. lawmakers are already raising alarms. Republican Rep. John Moolenaar called any COSCO stake a national security risk, foreshadowing possible legislative or regulatory intervention.
- Any policy moves to block Chinese port influence could come with domestic infrastructure incentives, which may favor expanded U.S. rail capacity linked to “clean” terminal ownership.
What PFL Recommends:
- Keep an Eye on July 27: That’s when exclusive sale talks expire. Expect a flurry of headlines—and potentially, market responses.
- Reassess Intermodal Options: Have contingency plans ready for routing through alternate ports and rail corridors.
- Engage Now on Rail Access: Whether the deal closes or not, ports will need partners in rail. Early engagement could secure priority in future infrastructure upgrades.
- Watch Washington: Rail policy could get swept into broader national security discussions around port ownership—don’t get caught flat-footed.
The Takeaway:
This isn’t just a port story, it’s a rail freight story in disguise! Shifting port ownership and geopolitical gamesmanship could redraw the North American freight map.
We are watching Class 1 Industry Headcount
Class I’s employed 118,975 workers in the United States in June, a -0.29% decrease from May 2025’s count but a -2.24% year-over-year decrease, according to Surface Transportation Board data.


Two of the six employment categories posted month-over-month increases between May and June. They were: executives, officials, and staff assistants, up 0.60% to 8,011 workers; and professional and administrative, up 1.10% to 9,302.
Categories that posted month-over-month decreases were maintenance of way and structures, down -0.04% to 29,077; maintenance of equipment and stores, down -0.29% to 17,014; transportation (other than train and engine), down -0.40% to 4,959; and transportation (train and engine), down -0.81% to 50,612.
Year over year, two categories posted employment gains. They were: executives, officials, and staff assistants, up 1.06%; and maintenance of way and structures, up 0.26%.
Categories that registered year-over-year decreases in June were transportation (train and engine), -3.31%; maintenance of equipment and stores, -2.69%; professional and administrative, -6.15%; and transportation (other than train and engine), -1.41%.
We are watching key Economic Indicators
Industrial Output & Capacity Utilization
Manufacturing accounts for approximately 75% of total output. Manufacturing output in June increased by 0.05% from May 2025, showing slight improvement despite ongoing economic pressures. Capacity utilization, which measures how fully firms are using their machinery and equipment, decreased by -0.08% from May to June, continuing the trend of modest declines in recent months. This reflects ongoing inefficiencies and challenges within manufacturing sectors, possibly influenced by rising input costs and trade-related uncertainties.

Lease Bids
• 30-50, 6000cf Steel Hopper located off of CSX or NS in East. For use in petcoke service. Period: 5 Years.
• 50, 5000CF Covered Hopper located off of UP or BN in Houston. For use in Fertilizer service. Period: 6 Months. Bid: Negotiable.Needed ASAP.
• 10, 2500CF Open Top Hopper located off of UP or BN in Texas. For use in aggregate service. Period: 5 years. Bid: Negotiable. Need Rapid Discharge Doors.
• 20, 25.5k CPC 1232 Tank located off of UP, BN, CSX, NS in OK, TX, Northeast. For use in Asphalt service. Period: 3 Years. Bid: Negotiable.
• 10, 25.5K Any Type Tank located off of CSX in Florida. For use in UCO service. Period: 2 Years. Bid: Negotiable.
• 100, 30K 117J Tank located off of BN in Montana. For use in Crude service. Period: 2 years. Bid: Negotiable.
• 20, 30K 117J Tank located off of UP or BN in Midwest. For use in Ethanol service. Period: 5 Years. Bid: Negotiable.
• 15, 29K 117R Tank located off of NS or CSX in Ohio. For use in Ply Oil service. Period: 6-12 Months. Bid: Negotiable.
• 10, 30K 117R or 117J Tank located off of Any Class 1 in USA. For use in Glycerin service. Period: 1 year. Bid: Negotiable.
• 50, 23.5-25.5 DOT111 Tank located off of Any Class 1 in USA. For use in Asphalt service. Period: 5 years. Bid: Negotiable.
• 10, 25.5K Tank Any Type located off of Any Class 1 in Any Location. For use in Asphalt service. Period: 3-12 months. Bid: Negotiable.
• 100, 33K 117J Tank located off of BN or UP in Bellview. For use in Butane/ service. Period: Sept-March. Bid: Negotiable.
• 4, 30K 117J Tank located in Michigan. For use in Food Grade Ethanol service. Period: Multi-year. Bid: Negotiable.
• 10-20, 29K Tank CPC 1232 located off of CP in Washington, Iowa. For use in Biodiesel service. Period: 1 Year min. Bid: Negotiable.
• 50, 33K Tank 117J located off of CP or CN in Canada. For use in Propane service. Period: Summer. Bid: Negotiable.
• 6, 4750 Hopper N/A located off of NS in Georgia. For use in Fertilizer service. Period: 3-5 years. Bid: Negotiable.
Sales Bids
• 28, 3400CF located off of UP BN in Texas. For use in Cement service. Bid: Negotiable. Cement Gates needed.
• 20, 17K DOT111 located off of various class 1s in various locations. For use in corn syrup service.
Lease Offers
• 60, 4750 Hoppers located off of UP or BN in Eads, CO. Last used in Grain. Offer: Negotiable. UP to 5 Years, 3 Hopper, Gravity Gate, Trough Hatches.
• 100, 6250 Hoppers located off of UP in US. Last used in DDG. Offer: Negotiable. 1 Year term. Dirty to Dirty. Free move on UP..
• 20, 30K Tanks located off of BNSF in West Texas. Last used in Ethanol. Offer: Negotiable. 1 year minimum.
• 24, 25.5K-30K Tanks located off of UP or BN in Texas. Last used in Base Oils. Offer: Negotiable. 1-2 Year.
• 25, 19.6K Tanks located off of UP in US. Last used in Molases. Offer: Negotiable.
• 120, 29.8K Tanks located off of CPKC in MN. Last used in Ethanol. Offer: Negotiable.
• 50, 20K Tanks located off of UP or BN in Wichita Falls, TX. Last used in HCL. Offer: Negotiable.
• 50, 30K Tanks located off of CSX, NS, or CN in Detroit. Last used in Diesel. Offer: Negotiable. Multiyear.
• 50, 20K 117J located off of All Class 1s in N/A. Last used in Styrene. Offer: Negotiable. Cars are currently moving.
Sales Offers
• 21, 50′ Boxcar Plate Cs located off of various class 1s in NM. Offer: Negotiable. End of Life.
• 3, 50′ Boxcar Plate Cs located off of various class 1s in multiple locations. Offer: Negotiable. End of Life.
• 27, 50′ Boxcar Plate Cs located off of various class 1s in PQ. Offer: Negotiable. End of Life.
• 100, 3250 Covered Hoppers located off of various class 1s in multiple locations. Offer: Negotiable. Sand Cars.
• 5, 2740 Gondola Mills located off of various class 1s in NC. Offer: Negotiable. End of Life.
• 1, 2260 Gondola Mills located off of various class 1s in AL. Offer: Negotiable. End of Life.
• 30, 2740 Gondola Mills located off of various class 1s in multiple locations. Offer: Negotiable. End of Life.
• 21, 2740 Gondola Mills located off of various class 1s in WA. Offer: Negotiable. End of Life.
• 9, 4750 Covered Hopper N/As located off of various class 1s in multiple locations. Offer: Negotiable. End of Life.
• 5, 4750 Covered Hopper N/As located off of various class 1s in multiple locations. Offer: Negotiable. End of Life.
• 50, 31.8K Tank CPC 1232s located off of UP or BN in TX. Offer: Negotiable. Requal Due in 2025.
Call PFL today to discuss your needs and our availability and market reach. Whether you are looking to lease cars, lease out cars, buy cars, or sell cars call PFL today at 239-390-2885
Live Railcar Markets
| CAT | Type | Capacity | GRL | QTY | LOC | Class | Prev. Use | Offer | Note |
|---|
PFL will be at the Following Conferences

- Where: Calgary
- Attending: David Cohen (954-729-4774), Curtis Chandler(239-405-3365), Cyndi Popov (403-402-5043)

- Where: Grand Geneva Resort
- Attending: Brian Baker (239.297.4519)
- Conference Website

- Where: Loews Arlington Hotel
- Attending: Brian Baker (239.297.4519), David Cohen (954-729-4774), and Curtis Chandler (239-405-3365)
- Conference Website

- Where: The Westin Galleria Dallas
- Attending: David Cohen (954-729-4774), and Curtis Chandler (239-405-3365)
- Conference Website

- Where: The Westin Galleria Dallas
- Attending: Brian Baker (239.297.4519)
- Conference Website