
“Humanity has won its battle. Liberty now has a country.”
– Marquis de Lafayette
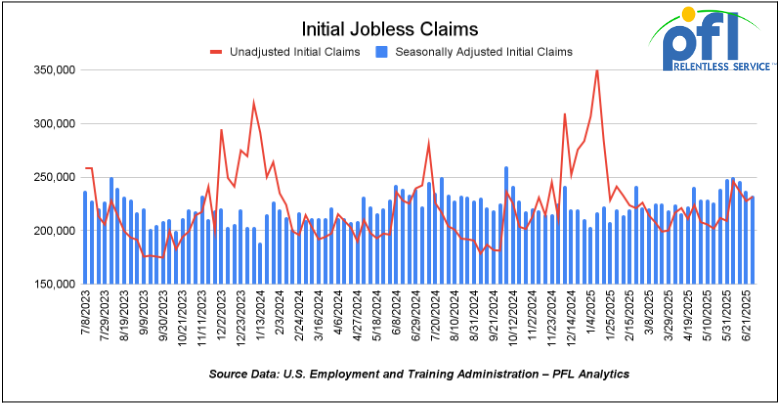
Jobs Update
- Initial jobless claims seasonally adjusted for the week ending June 28 came in at 233,000, down 4,000 people week over week week-over-week.
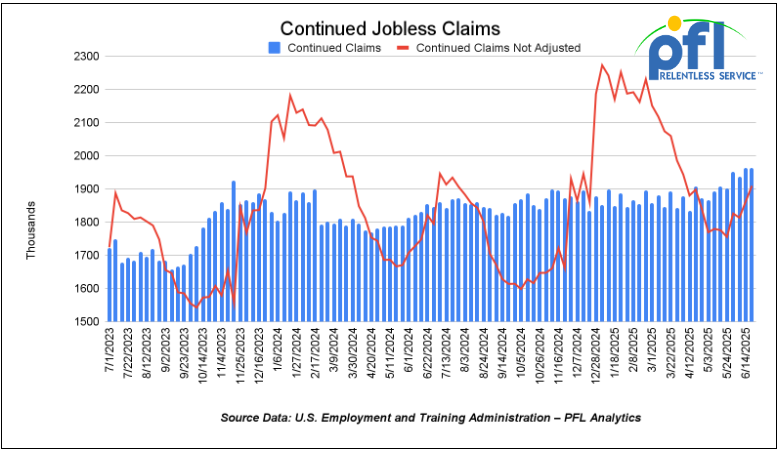
- Continuing jobless claims came in at 1.964 million people, versus the adjusted number of 1.964 million people from the week prior, flat week-over-week.
Stocks closed higher on Thursday of last week and higher week-over-week
The DOW closed higher on Thursday of last week, up 344.11 points (0.77%), closing out the week at 44.828.53, up 1,009.26 points week-over-week. The S&P 500 closed higher on Thursday of last week, up 51.93 points, and closed out the week at 6,279.35, up 106.28 points week-over-week. The NASDAQ closed higher on Thursday of last week, up 207.97 points, and closed out the week at 20,601.1, up 327.64 points week-over-week.
In overnight trading, DOW futures traded lower and are expected to open at 6,298.25 this morning down 26 points from Thursday’s close.
Crude oil closed lower on Thursday of last week, but higher week-over-week.
West Texas Intermediate (WTI) crude closed down $0.45 per barrel (-0.67%), to close at $67 per barrel on Thursday of last week, but up $1.48 per barrel week-over-week. Brent crude closed down $0.31 USD per barrel (-0.45%) on Thursday of last week, to close at $68.80 per barrel, up $1.03 cents per barrel week-over-week.
One Exchange WCS (Western Canadian Select) for August delivery settled on Friday of last week at US$10.30 below the WTI-CMA (West Texas Intermediate – Calendar Month Average). The implied value was US$54.91 per barrel.
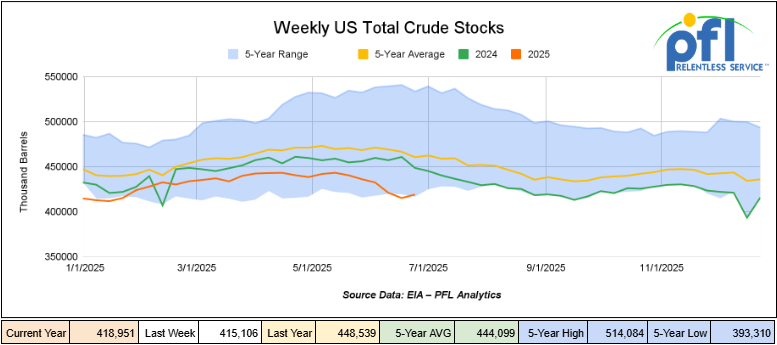
U.S. commercial crude oil inventories (excluding those in the Strategic Petroleum Reserve) increased by 3.8 million barrels week-over-week. At 419 million barrels, U.S. crude oil inventories are 9% below the five-year average for this time of year.
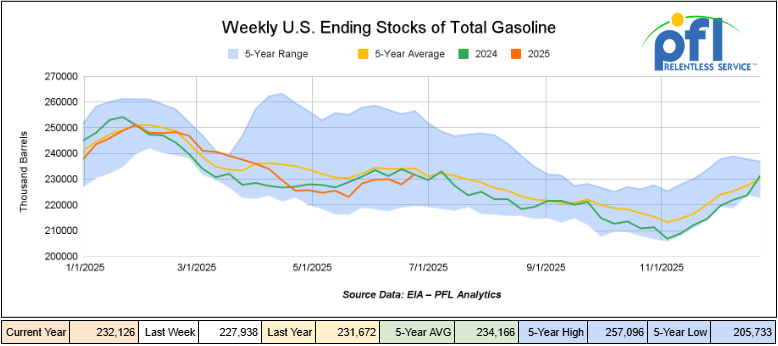
Total motor gasoline inventories increased by 4.2 million barrels week-over-week and are 1% below the five-year average for this time of year.
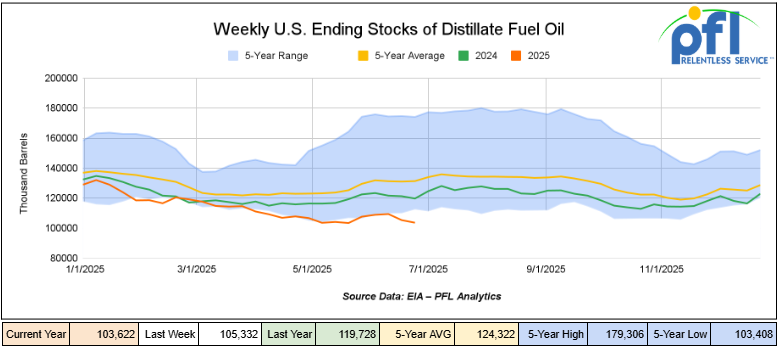
Distillate fuel inventories decreased by 1.7 million barrels week-over-week and are 21% below the five-year average for this time of year.
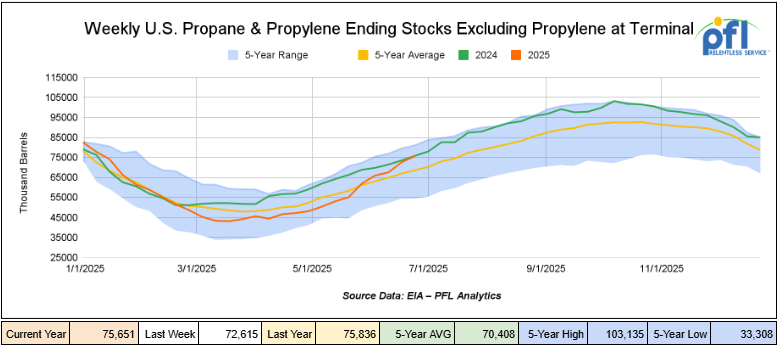
Propane/propylene inventories increased by 3 million barrels week-over-week and are 11% above the five-year average for this time of year.
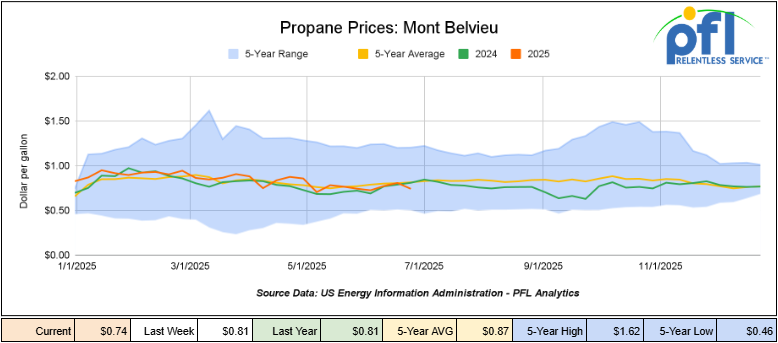
Propane prices closed at 74 cents per gallon on Friday of last week, down 7 cents per gallon week-over-week, and down 7 cents year-over-year.
Overall, total commercial petroleum inventories increased by 9.4 million barrels during the week ending June 27, 2025.
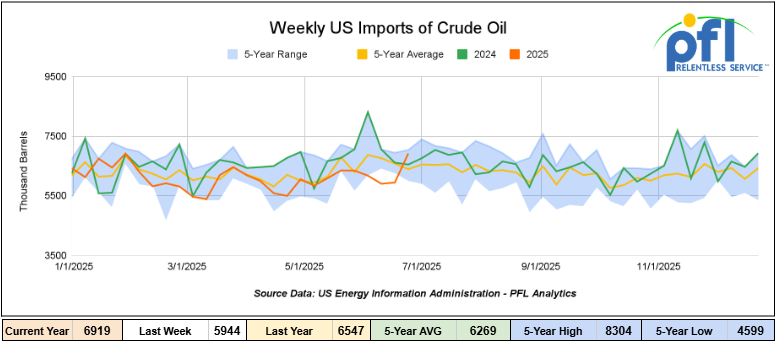
U.S. crude oil imports averaged 6.9 million barrels per day during the week ending June 27, 2025, an increase of 976,000 barrels per day week-over-week. Over the past four weeks, crude oil imports averaged 6.1 million barrels per day, 13.9% less than the same four-week period last year. Total motor gasoline imports (including both finished gasoline and gasoline blending components) averaged 906,000 barrels per day, and distillate fuel imports averaged 118,000 barrels per day during the week ending June 27, 2025.
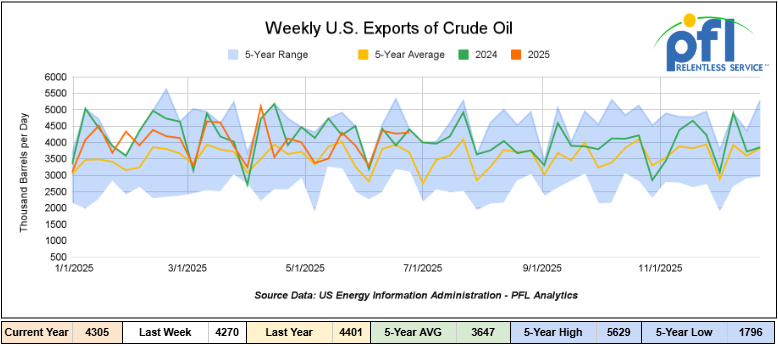
U.S. crude oil exports averaged 4.305 million barrels per day during the week ending June 27, 2025, an increase of 35,000 barrels per day week-over-week. Over the past four weeks, crude oil exports averaged 4.056 million barrels per day.
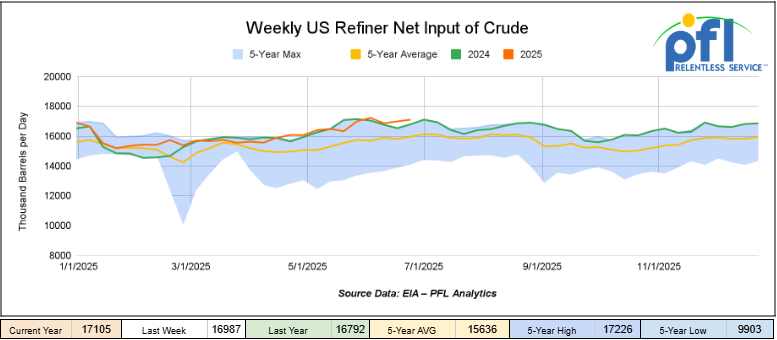
U.S. crude oil refinery inputs averaged 17.1 million barrels per day during the week ending June 27, 2025, which was 118,000 barrels per day more week-over-week.
WTI is poised to open at $66.82, down 18 cents per barrel from Thursday’s close.
North American Rail Traffic
Week Ending July 2, 2025.
Total North American weekly rail volumes were down (-2.27%) in week 27, compared with the same week last year. Total carloads for the week ending on July 2 were 326,357, down (1.52%) compared with the same week in 2024, while weekly intermodal volume was 323,353, down (-1.52%) compared to the same week in 2024.
7 of the AAR’s 11 major traffic categories posted year-over-year decreases. The largest decrease came from Forest Products, which was down (-16.04%), while the largest increase was from Grain, which was up (+13.68%).
In the East, CSX’s total volumes were down (-2.74%), with the largest decrease coming from Chemicals (-15.13%), while the largest increase came from Grain (+15.16%). NS’s volumes were down (-0.95%), with the largest increase coming from Grain (+15.32%), while the largest decrease came from Nonmetallic Minerals (-8.22%).
In the West, BN’s total volumes were down (-0.52%), with the largest increase coming from Motor Vehicles and Parts (+21.05%), while the largest decrease came from Metallic Ores and Metals (-21.02%). UP’s total rail volumes were up (+0.43%), with the largest increase coming from Coal (+19.97%), while the largest decrease came from Metallic Ores and Metals (-9.47%).
In Canada, CN’s total rail volumes were down (-5.2%) with the largest increase coming from Grain (+15.76%) while the largest decrease came from Other (-25.63%). CPKCS’s rail volumes were down -21.73%, with the largest increase coming from Nonmetallic Minerals (+4.24%), while the largest decrease came from Forest Products (-67.26%).
Source Data: AAR – PFL Analytics
Rig Count
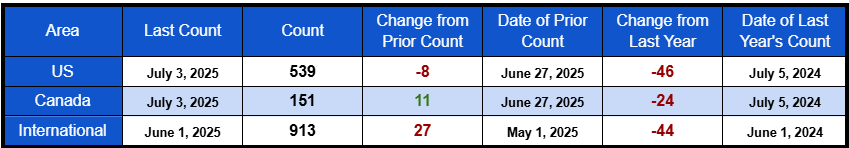
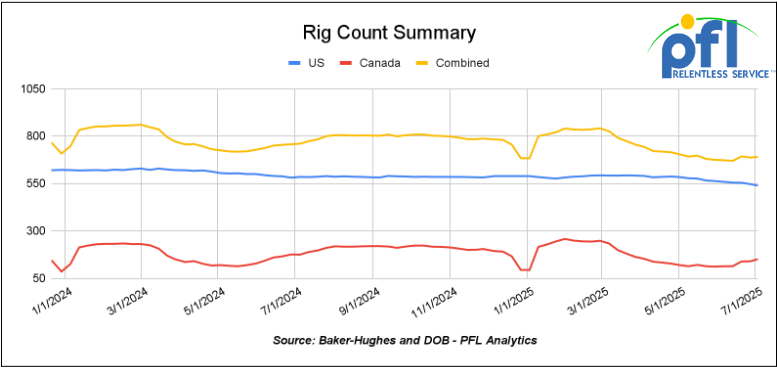
North American rig count was up by 3 rigs week-over-week. U.S. rig count was down -8 rigs week over week and down by -46 rigs year-over-year. The U.S. currently has 539 active rigs. Canada’s rig count was up 11 rigs week-over-week, but down by -24 rigs year-over-year. Canada currently has 151 active rigs. Overall, year-over-year, we are down by -70 rigs collectively.
International rig count was up by 27 rigs month-over-month, but down -44 rigs year-over-year. Internationally there are 913 rigs.
North American Rig Count Summary
We are watching a few things out there for you:
We are watching Petroleum Carloads
The four-week rolling average of petroleum carloads carried on the six largest North American railroads rose to 28,326 from 28,195 which was an increase of +131 rail cars week-over-week. Canadian volumes were mixed. CPKC’s shipments were higher by +4.0% week over week, CN’s volumes were lower by -8.0% week-over-week. U.S. shipments were mostly lower across the board. The BN had the largest percentage decrease and was down by -13%.
We are watching Key Economic Indicators
PMI:
The U.S. manufacturing sector continued its contraction in June, with the Institute for Supply Management (ISM) Manufacturing PMI declining to 48.3%, down from 48.5% in May. This marks the fourth consecutive month of contraction, attributed largely to the impact of tariffs, which have continued to increase material costs, reduce production, and disrupt import and export volumes.
The services sector contracted in June, with the ISM Services PMI decreasing to 49.2% from 49.9% in May, indicating a slight contraction. This downturn reflects ongoing concerns over trade tensions, rising input costs, and supply chain disruptions that have impacted business sentiment.
Conversely, S&P Global’s U.S. Services PMI rose to 54.1% in June from 53.7% in May, marking the 29th consecutive month of expansion. This increase suggests that, despite broader economic challenges, some service sectors continue to experience growth, though rising costs remain a concern, largely driven by ongoing tariffs.

Unemployment:
In June 2025, the total nonfarm payroll employment increased by 165,000, following revised gains of 139,000 in May and 147,000 in April. The unemployment rate remained steady at 4.2%, which is unchanged from May. Job gains were concentrated in healthcare (+55,000), leisure and hospitality (+40,000), and professional and business services (+22,000). Federal government employment declined by 18,000 jobs. Despite economic uncertainties, including fluctuating trade policies, the labor market continues to show resilience.

Finally, we were watching fireworks this past weekend
As with PFL tradition we had a company barbeque with friends – please click the video below and Happy 4th – we hope the year ahead is full of happiness and success for all our listeners and readers.
Lease Bids
- 10, 2500CF Open Top Hoppers needed off of UP or BN in Texas for 5 years. Cars are needed for use in aggregate service. Need Rapid Discharge Doors
- 50, 5000CF Covered Hoppers needed off of UP or BN in Houston for 6 Month. Cars are needed for use in Fertilizer service. Needed ASAP
- 30-50, 6000cf Steel Hoppers needed off of CSX or NS in East for 5 Year. Cars are needed for use in petcoke service.
- 50, 23.5-25.5 DOT111 Tanks needed off of Any Class 1 in USA for 5 years. Cars are needed for use in Asphalt service.
- 20, 25.5k CPC 1232 Tanks needed off of UP, BN, CSX, NS in OK, TX, Northeast for 3 Year. Cars are needed for use in Asphalt service.
- 10, 30K 117R or 117J Tanks needed off of Any Class 1 in USA for 1 year. Cars are needed for use in Glycerin service.
- 15-20, 29K 117R Tanks needed off of NS or CSX in Ohio for 6-12 Months. Cars are needed for use in Ply Oil service.
- 20, 30K 117J Tanks needed off of UP or BN in Midwest for 5 Years. Cars are needed for use in Ethanol service.
- 100, 30K 117J Tanks needed off of BN in Montana for 2 years. Cars are needed for use in Crude service.
- 10, 25.5K Any Type Tanks needed off of CSX in Florida for 2 Years. Cars are needed for use in UCO service.
- 10, 25.5K Any Type Tanks needed off of Any Class 1 in Any Location for 3-12 months. Cars are needed for use in Asphalt service.
- 6, 30K 117R or 117J Tanks needed off of Any Class 1 in USA for 1 year. Cars are needed for use in Av Gas service.
- 10, 25.5K-30K 117R or 117J Tanks needed off of UP or BN in Texas for 1 year. Cars are needed for use in Dicyclopentadiene service.
- 70, 30K DOT 117R/ DOT 117J Tanks needed off of UP in Corpus Christi for 5 Year. Cars are needed for use in Gasoline service.
- 20, 28.3K 117J Tanks needed off of BN in Montana for 2 years. Cars are needed for use in Crude service.
Sales Bids
- 28, 3400CF Covered Hoppers needed off of UP BN in Texas. Cars are needed for use in Cement service. Cement Gates needed.
- 20, 17K DOT111 Tanks needed off of various class 1s in various locations. Cars are needed for use in corn syrup service.
Lease Offers
- 60, 4750, Covered Hoppers located off of UP or BN in Eads, CO. Cars are clean UP to 5 Years, 3 Hopper, Gravity Gate, Trough Hatches
- 100, 6250, Covered Hoppers located off of UP in US . Cars were last used in DDG. 1 Year term. Dirty to Dirty. Free move on UP.
- 50, 33K, 400W Pressure Tanks located off of All Class 1s in US and Canada. Cars were last used in Propane. Summer or Longer Lease Available.
- 50, 29K , DOT 111 Tanks located off of CN in Hamilton, ON. Cars were last used in Biodiesel. 1 year +
- 20-25, 30K, 117J Tanks located off of BNSF in West Texas. Cars were last used in Ethanol. 1 year minimum
- 24, 25.5K-30K, DOT 111 Tanks located off of UP or BN in Texas. Cars were last used in Base Oils. 1-2 Year
- 25-50, 19.6K, DOT 111 Tanks located off of UP in US. Cars were last used in Molases .
- 10, 30, 117R Tanks located off of CN in Wisconsin. Cars were last used in Gasoline. Multiyear
- 33, 30, 117R Tanks located off of UP in Gulf. Cars are clean Multiyear
- 50, 30, 117R Tanks located off of UP in Gulf. Cars were last used in Diesel. Multiyear
- 120, 29.8K, 117R/117J Tanks located off of CPKC in MN. Cars were last used in Ethanol.
- 50, 20K, DOT 111 Tanks located off of UP or BN in Wichita Falls, TX. Cars were last used in HCL.
- 50-100, 117R/117J Tanks located off of CN, CP, UP, CSXT in Various. Cars were last used in Biodiesel. Summer – 4 months
- 50-100, 117R/117J Tanks located off of CN, CP, UP, CSXT in Various. Cars were last used in Diesel . Summer – 4 months
Sales Offers
- 21, 50′, Plate C Boxcars located off of various class 1s in NM. End of Life
- 3, 50′, Plate C Boxcars located off of various class 1s in multiple locations. End of Life
- 27, 50′, Plate C Boxcars located off of various class 1s in PQ. End of Life
- 100-300, 3250, Covered Hoppers located off of various class 1s in multiple locations. Sand Cars
- 5, 2740, Mill Gondolas located off of various class 1s in NC. End of Life
- 1, 2260, Mill Gondolas located off of various class 1s in AL. End of Life
- 30, 2740, Mill Gondolas located off of various class 1s in multiple locations. End of Life
- 21, 2740, Mill Gondolas located off of various class 1s in WA. End of Life
- 15, 4750, Covered Hoppers located off of various class 1s in multiple locations. End of Life
- 5, 4750, Covered Hoppers located off of various class 1s in multiple locations. End of Life
- 50-100, 31.8K, CPC 1232 Tanks located off of UP or BN in TX. Requal Due in 2025
Call PFL today to discuss your needs and our availability and market reach. Whether you are looking to lease cars, lease out cars, buy cars, or sell cars call PFL today at 239-390-2885
Live Railcar Markets
| CAT | Type | Capacity | GRL | QTY | LOC | Class | Prev. Use | Offer | Note |
|---|
PFL will be at the Following Conferences

- Where: Calgary
- Attending: David Cohen (954-729-4774), Curtis Chandler(239-405-3365), Cyndi Popov (403-402-5043)

- Where: Grand Geneva Resort
- Attending: Brian Baker (239.297.4519)
- Conference Website

- Where: Loews Arlington Hotel
- Attending: Brian Baker (239.297.4519), David Cohen (954-729-4774), and Curtis Chandler (239-405-3365)
- Conference Website

- Where: The Westin Galleria Dallas
- Attending: David Cohen (954-729-4774), and Curtis Chandler (239-405-3365)
- Conference Website

- Where: The Westin Galleria Dallas
- Attending: Brian Baker (239.297.4519)
- Conference Website