
“Progress never comes from those satisfied with the failures of a broken system, it comes from those who want to fix the broken system” – Donald Trump
Jobs Update
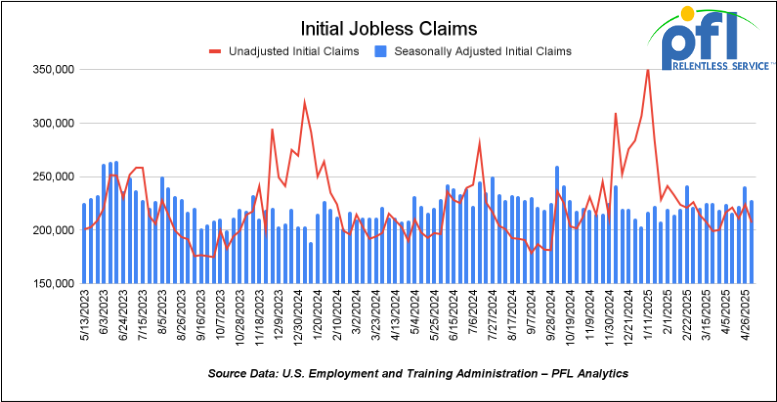
- Initial jobless claims seasonally adjusted for the week ending May 3rd came in at 228,000, down 13,000 people week-over-week.
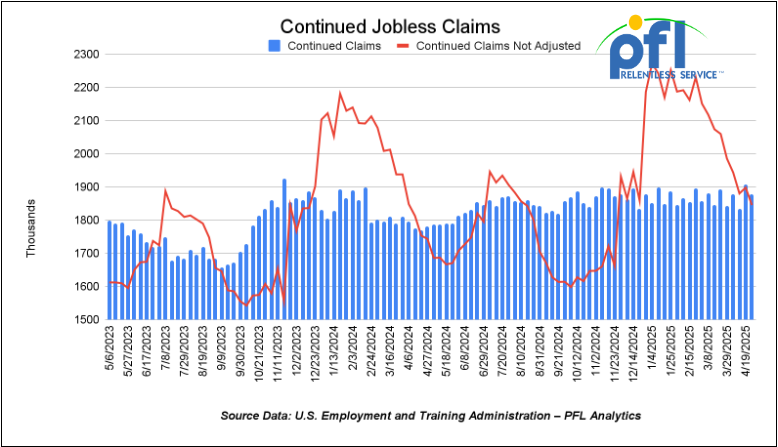
- Continuing jobless claims came in at 1.879 million people, versus the adjusted number of 1.908 million people from the week prior, down 29,000 people week-over-week.
Stocks closed lower on Friday of last week, but mixed week over week
The DOW closed lower on Friday of last week, down -119.07 points (-0.29%) and closing out the week at 41,249.38, down -68.06 points week-over-week. The S&P 500 closed lower on Friday of last week, down -4.03 points, and closed out the week at 5,659.91 down -23.76 points week-over-week. The NASDAQ closed higher on Friday of last week, up +0.78 points, and closed out the week at 17,928.92, down -48.81 points week-over-week.
In overnight trading, DOW futures traded higher and are expected to open at 42,208 this morning up 885 points from Friday’s close.
Crude oil closed higher on Friday of last week and higher week over week.
West Texas Intermediate (WTI) crude closed up $1.11 per barrel (1.9%), to close at $61.91 per barrel on Friday of last week and up $2.72 per barrel week over week. Brent crude closed up $1.07 USD per barrel (1.7%) on Friday of last week, to close at $63.91 per barrel and up $2.62 per barrel week-over-week.
One Exchange WCS (Western Canadian Select) for June delivery settled on Friday of last week at US$9.10 below the WTI-CMA (West Texas Intermediate – Calendar Month Average). The implied value was US$50.28 per barrel.
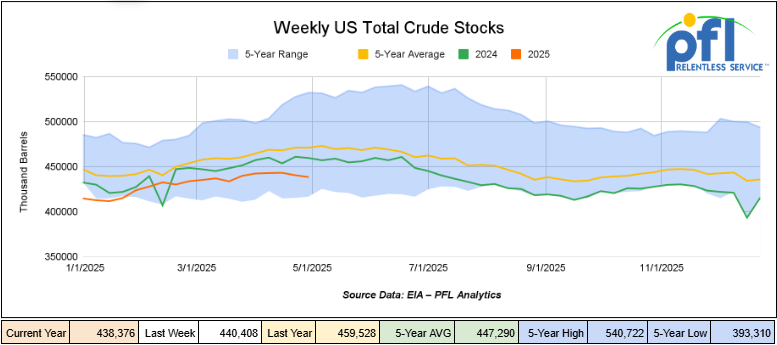
U.S. commercial crude oil inventories (excluding those in the Strategic Petroleum Reserve) decreased by 2 million barrels week-over-week. At 438.4 million barrels, U.S. crude oil inventories are 7% below the five-year average for this time of year.
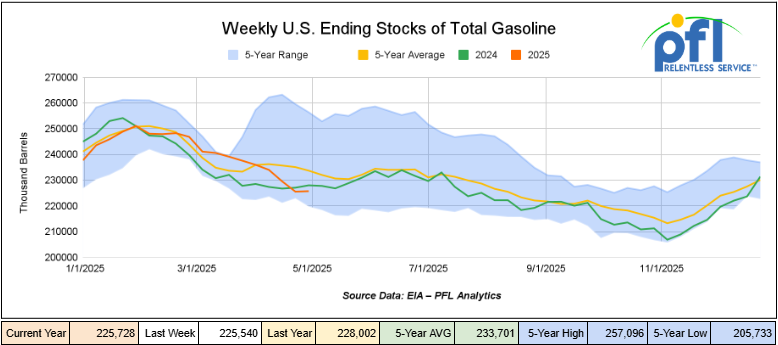
Total motor gasoline inventories increased by 200,000 barrels week-over-week and are 3% below the five-year average for this time of year.
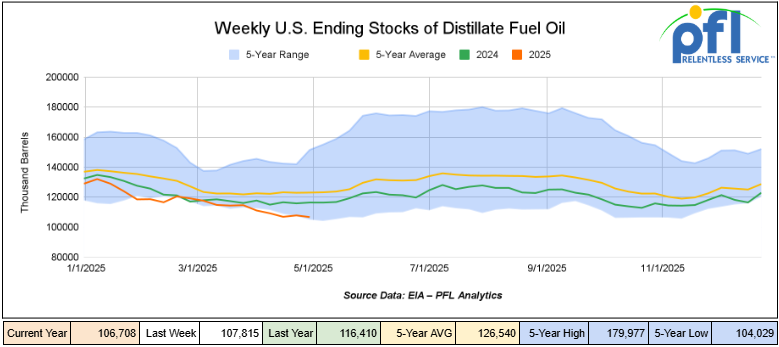
Distillate fuel inventories decreased by 1.1 million barrels week-over-week and are 13% below the five-year average for this time of year.
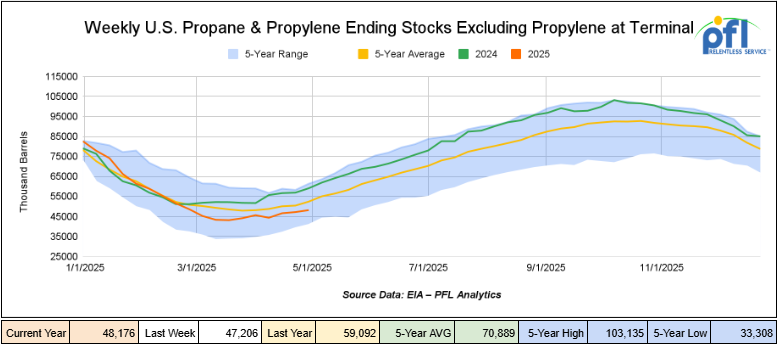
Propane/propylene inventories increased by 1 million barrels week-over-week and are 11% below the five-year average for this time of year.
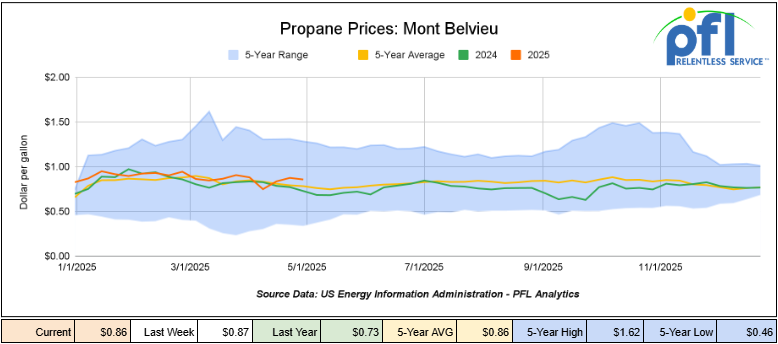
Propane prices closed at 86 cents per gallon on Friday of last week, down 1 cent per gallon week-over-week, and up 13 cents per gallon year-over-year.
Overall, total commercial petroleum inventories increased by 1.2 million barrels during the week ending May 2, 2025.
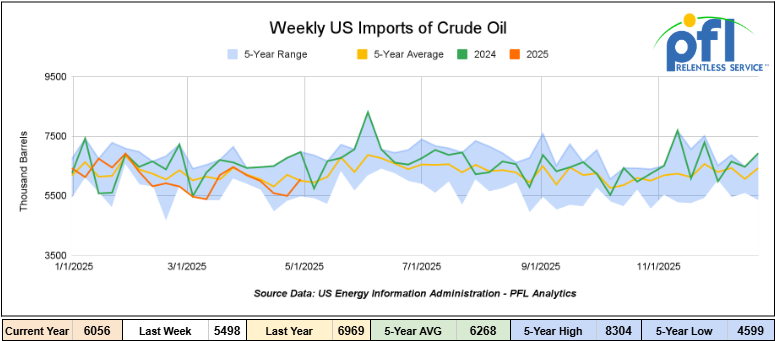
U.S. crude oil imports averaged 6 million barrels per day during the week ending May 2, 2025, an increase of 557,000 barrels per day week-over-week. Over the past four weeks, crude oil imports averaged 5.8 million barrels per day, 13.3% less than the same four-week period last year. Total motor gasoline imports (including both finished gasoline and gasoline blending components) averaged 765,000 barrels per day, and distillate fuel imports averaged 117,000 barrels per day during the week ending May 2, 2025.
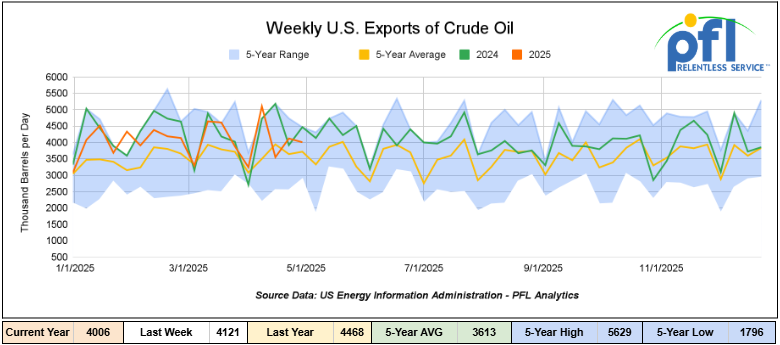
U.S. crude oil exports averaged 4.006 million barrels per day during the week ending May 2, 2025, a decrease of 115,000 barrels per day week-over-week. Over the past four weeks, crude oil exports averaged 4.194 million barrels per day.
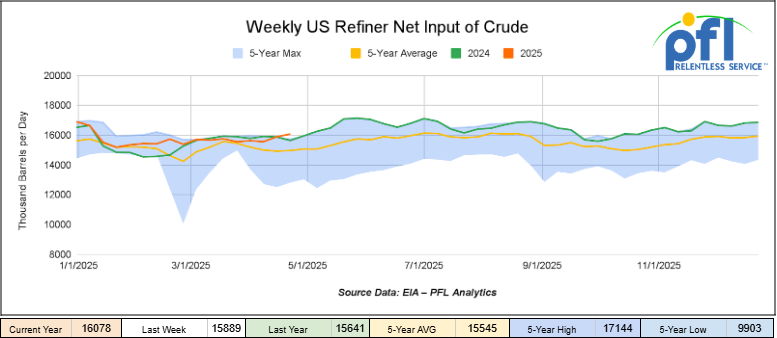
U.S. crude oil refinery inputs averaged 16.1 million barrels per day during the week ending May 2, 2025, which was 7,000 barrels per day less week-over-week.
WTI is poised to open at $62.91, up $1.89 per barrel from Thursday’s close.
North American Rail Traffic
Week Ending May 7, 2025.
Total North American weekly rail volumes were up (+4.84%) in week 19, compared with the same week last year. Total carloads for the week ending on May 7 were 346,656, up (3.43%) compared with the same week in 2024, while weekly intermodal volume was 334,777, up (+6.33%) compared to the same week in 2024.
6 of the AAR’s 11 major traffic categories posted year-over-year increases. The largest increase came from Coal, which was up (+21.51%), while the largest decrease was from Metallic ores and Metals, which was down (-6.15%).
In the East, CSX’s total volumes were up (2.3%), with the largest decrease coming from Metallic Ores and Metals (-9.6%) while the largest increase came from Coal (+11.86%). NS’s volumes were up (6.78%), with the largest increase coming from Metallic Ores and Metals (+16.61%) while the largest decrease came from Grain (-7.31%).
In the West, BN’s total volumes were up (9.92%), with the largest increase coming from Coal (23.13%) while the largest decrease came from Metallic Ores and Metals (-18.47%). UP’s total rail volumes were up (+5.22%), with the largest increase coming from Coal (+40.91%), while the largest decrease came from Other (-18.36%).
In Canada, CN’s total rail volumes were down (-10.37%) with the largest increase coming from Grain, up (+98.55%), while the largest decrease came from Intermodal Units (-24.43%). CP’s total rail volumes were up (11.65%) with the largest increase coming from Coal (+84.72%), while the largest decrease came from Petroleum and Petroleum Products (30.93%).
KCS’s total rail volumes were down (2.87%) with the largest increase coming from Coal (55.24%), while the largest decrease came from Intermodal (-15.39%).
Source Data: AAR – PFL Analytics
Rig Count
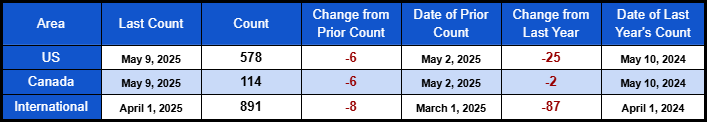
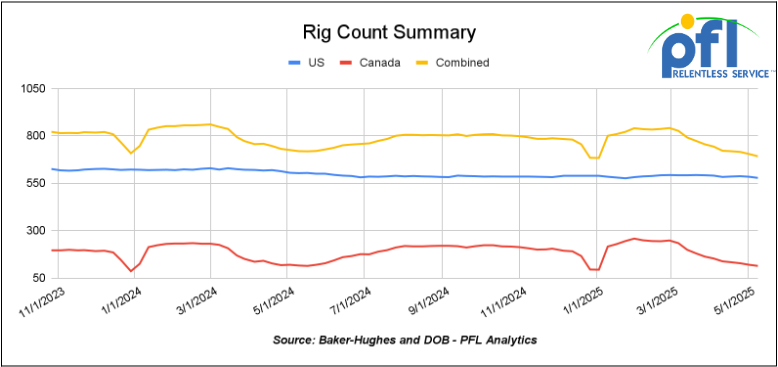
North American rig count was down by -12 rigs week-over-week. U.S. rig count was down -6 rigs week over week, and down by -25 rigs year-over-year. The U.S. currently has 578 active rigs. Canada’s rig count was down -6 rigs week-over-week but flat year-over-year. Canada currently has 114 active rigs. Overall, year over year we are down by -27 rigs collectively.
North American Rig Count Summary
A few things we are watching:
We are watching Petroleum Carloads
The four-week rolling average of petroleum carloads carried on the six largest North American railroads rose to 26,949 from 26,637 which was an increase of +112 rail cars week-over-week. Canadian volumes were lower. CPKC’s shipments were lower by -9.8% week over week, CN’s volumes were lower by -1.7% week-over-week. U.S. shipments were mixed. The CSX had the largest percentage increase and was up by +1.1%. The NS had the largest percentage decrease and was down by -14.9%.
We are watching Biodiesel
PFL has been closely monitoring recent policy developments out of Washington, D.C. that could have a significant impact on rail volumes tied to the biofuels sector. On May 2, H.R. 3137 was introduced, a bill that would reinstate the $1/gal biodiesel blenders tax credit (BTC) retroactive to January 1, 2025, and extend it through December 31, 2026.
On May 8th, the SABR Coalition, made up of more than 70 biodiesel producers, publicly backed the bill, calling the BTC “critically necessary” to restart operations at idle plants and bring back jobs lost when the credit expired at the end of 2024.
Joe Jobe from SABR said, “This bill would turn the markets back on immediately. The BTC has existing rules in place, and the industry knows how to work with them.”
Many facilities across the biodiesel supply chain have been shuttered due to uncertainty around the Section 45Z credit, created under the Inflation Reduction Act, but still awaiting implementation rules. Unlike BTC, the 45Z credit favors sustainable aviation fuel (SAF) and renewable diesel, with SAF producers potentially earning up to $1.75 per gallon – while biodiesel producers get far less and face heavier red tape. The lack of biodiesel production has been a major cause of the surge in RIN pricing since the beginning of the year:

According to some, the BTC would help level the playing field and restore confidence across the value chain. With biodiesel and its feedstocks primarily moved by rail, the return of the credit could lead to a notable uptick in tank car movements, especially in rural areas hardest hit by the downturn.
Key Dates:
- May 2: H.R. 3137 introduced in the House
- May 8: SABR issues formal backing and outreach to Congress
- Late May–June: Committee review expected
- June–July: Possible House vote and Senate action
At PFL, we’re keeping a close eye on how this legislation evolves and what it could mean for our clients navigating today’s dynamic and ever changing rail market. If you’re looking to better understand how policy shifts like this affect your rail strategy, we’re here to help.
We are watching Port Traffic — Rail Braces for Volume Drop
Recent shifts in U.S. trade policies has introduced volatility in financial markets and heightened uncertainty for firms. The ultimate outcomes and impacts of these policy changes remain unclear. Nevertheless, U.S. rail volumes have thus far remained stable, and many core economic indicators continue to signal underlying resilience. However, we are seeing some headwinds.
After months of elevated container volumes, the West Coast’s inbound freight engine is cooling – fast.
The Port of Los Angeles is now projecting a 35% drop in import volumes for May following a surge of front-loaded shipments in April. Long Beach isn’t far behind, anticipating a 20% year-over-year decline. That slowdown is being felt across the rail network, as intermodal flows taper off and supply chain velocity shifts into a lower gear.
The abrupt decline is largely tied to the April imposition of new tariffs on Chinese imports, some as high as 145%. That triggered a final wave of cargo in late April, as shippers rushed to beat the deadline – but since then, containerized volumes have fallen sharply.
Maersk reported a 30-40% plunge in U.S.- China container traffic. Meanwhile, ports in Seattle-Tacoma and Oakland are also seeing slack demand, with blank sailings and vessel diversions now common.
Retailers and manufacturers relying on Asia-sourced goods are reporting shortages in categories like toys, electronics, and seasonal merchandise. With many importers hitting pause amid the policy uncertainty, rail’s intermodal segment is feeling the slowdown.
For railroads, especially those tied to the LA – Chicago and LA – Dallas corridors, the slowdown is already prompting schedule adjustments, shorter consists, and asset repositioning. Train starts have dipped, and in some terminals, labor hours have been scaled back as volume stalls.
This is a sharp reversal from Q1’s strong momentum, when near-record import levels drove consistent intermodal demand. Now, with container volume down, the challenge is to preserve fluidity while staying nimble.
Some cargo could reroute via Canada, Mexico, or even Gulf and East Coast ports, but longer transit times and infrastructure constraints may limit those gains in the near term.
What to watch:
- Intermodal Bookings: Early indicators suggest deeper declines into June, unless trade policy shifts.
- Inventory Rebuilds: Retailers may re-enter the market suddenly — or delay until Q3.
- Alternate Gateways: Watch Lázaro Cárdenas (MX) and Prince Rupert (BC) for possible volume redirection.
- Policy Signals: Any changes to U.S.–China tariffs will reset supply chain expectations quickly.
Final Take Away:
For now, what we’re seeing is a classic bullwhip effect – first a surge, now a sharp snapback. With trade talks underway and this morning’s announcement that Chinese tariffs will only increase by 10% from current levels of 20% it is anyone’s guess what traffic gets quickly diverted back to west coast ports or what will happen once that 90 day pause is up, rail faces a more volatile near-term outlook. Network flexibility and close coordination across terminals will be essential.
Stay tuned to PFL, we continue to monitor developments closely.
We are Watching Class 1 Industry Head Count
Class I railroads employed 119,543 workers in the United States in March 2025, a -0.02% decrease from February 2025’s count of 119,562 and a -2.76% year-over-year decrease from March 2024’s total of 122,941, according to Surface Transportation Board data.


Three of the six employment categories posted month-over-month increases between February and March 2025. These were Professional and Administrative, up 0.10% to 9,666 workers; Maintenance of Way and Structures, up 0.19% to 28,546 workers; and Transportation (train and engine), which increased 0.02% to 51,461 workers.
The categories that posted month-over-month decreases were Executives, officials, and staff assistants, down -0.31% to 7,838 workers; Maintenance of Equipment and Stores, down -0.16% to 17,022 workers; and Transportation (other than train and engine), down -0.81% to 5,010 workers.
Year over year, only one category posted an employment gain: Transportation (other than train and engine), up 1.56%.
Categories that registered year-over-year decreases in March 2025 were Executives, officials, and staff assistants, down -2.89%; Professional and Administrative, down -5.67%; Maintenance of Way and Structures, down -1.19%; Maintenance of Equipment and Stores, down -4.85%; and Transportation (train and engine), down -2.74%.
We are Watching Key Economic Indicators
U.S. Unemployment
Total nonfarm payroll employment increased by 177,000 in April, following revised gains of 228,000 in March and 117,000 in February. The unemployment rate remained steady at 4.2%, unchanged from March. Job gains were concentrated in healthcare (+51,000), transportation and warehousing (+29,000), financial activities (+14,000), and social assistance (+8,000). Federal government employment declined by 9,000 jobs. Despite ongoing economic uncertainties, including rising tariffs, the labor market continues for the time being is showing resilience.

Purchasing Managers Index ( PMI)
The U.S. manufacturing sector continued to contract in April, with the Institute for Supply Management (ISM) Manufacturing PMI declining to 48.7%, down from 49.0% in March. This marks the second consecutive month of contraction, attributed largely to the impact of tariffs, which have led to increased material costs, declining production, and reduced import and export volumes.
The services sector presented mixed signals in April. The ISM Services PMI increased to 51.6% from 50.8% in March, indicating modest expansion. This uptick was driven by a rise in new orders and higher input prices, with the prices paid index reaching its highest level since January 2023. However, employment in the sector continued to contract for the second consecutive month.
Conversely, S&P Global’s U.S. Services PMI fell sharply to 50.8% from 54.4% in April, marking the lowest reading since November 2023. This decline suggests that market uncertainties, particularly surrounding tariffs, are impacting services sectors such as education, real estate, and utilities, contributing to pricing pressures.

We are watching Washington and our tax dollars at work
In case you missed it, a federal judge in San Francisco temporarily blocked the Trump administration’s sweeping overhaul of the federal government on Friday of last week. U.S. District Judge Susan Illston, a Clinton appointee, came after a hearing Friday in a lawsuit filed by a coalition of labor unions, nonprofits and local governments.
The plaintiffs argue in their complaint that President Trump’s efforts to “radically restructure and dismantle the federal government” without any authorization from Congress violate the Constitution. Illston agreed with the plaintiffs, asserting in the hearing that Supreme Court precedent makes clear that while the President does have the authority to seek changes at agencies, he must do so in lawful ways.
Illston issued a temporary restraining order pausing further implementation of Trump’s Feb. 11 executive order directing agencies to begin major reorganizations, as well as subsequent memos from his administration instructing agencies how to comply. Her order applies to 20 federal agencies.
During Friday’s hearing, Illston said a temporary restraining order was necessary “to protect the power of the legislative branch.”
The order is in effect for 14 days, through May 23. Although temporary restraining orders, intended to be stop-gap measures, are generally not appealable, the Trump administration nevertheless filed an appeal with the 9th Circuit Court of Appeals hours after Illston issued her decision.
The government argued a temporary restraining order was inappropriate.
In court on Friday, the Trump administration’s lawyer, Deputy Assistant Attorney General Eric Hamilton, argued the plaintiffs’ request for a temporary restraining order was inappropriate given how much time has lapsed since Trump first signed the executive order to reshape the government.
Relief sought as layoffs had begun:
The plaintiffs in the case, including the American Federation of Government Employees and several of its local branches, the American Public Health Association and the cities of Chicago, Baltimore and San Francisco, had sought relief as agencies had already begun mass layoffs.
Judge Illston’s 14-day temporary restraining order applies to the following agencies:
- Office of Management and Budget
- Office of Personnel Management
- Department of Agriculture
- Department of Commerce
- Department of Energy
- Department of Health and Human Services
- Department of Housing and Urban Development
- Department of the Interior
- Department of Labor
- Department of State
- Treasury Department
- Department of Transportation
- Department of Veterans Affairs
- AmeriCorps
- Environmental Protection Agency
- General Services Administration
- National Labor Relations Board
- National Science Foundation
- Small Business Administration
- Social Security Administration
- Department of Government Efficiency (not a formally established government agency)
We don’t know how this one will play out, but it looks like there is a pause on restructuring.
Lease Bids
- 10, 2500CF Open Top Hoppers needed off of UP or BN in Texas for 5 years. Cars are needed for use in aggregate service. Need Rapid Discharge Doors
- 25, 3230 PD Hoppers needed off of NS or CSX in Ohio for 5 years. Cars are needed for use in Flyash service.
- 100, 5200 Covered Hoppers needed off of UP or BN in Northwest for 6 month. Cars are needed for use in Pet Coke service. Roud Hatch, Bottom Outlet Doors
- 100, 4750 Covered Hoppers needed off of UP or BN in Texas for 1-5 Years. Cars are needed for use in Petcoke service.
- 50, 5000CF Covered Hoppers needed off of UP or BN in Houston for 6 Month. Cars are needed for use in Fertilizer service. Needed ASAP
- 50, 23.5-25.5 DOT111 Tanks needed off of Any Class 1 in USA for 5 years. Cars are needed for use in Asphalt service.
- 20, 25.5k CPC 1232 Tanks needed off of UP, BN, CSX, NS in OK, TX, Northeast for 3 Year. Cars are needed for use in Asphalt service.
- 10, 30K 117R or 117J Tanks needed off of Any Class 1 in USA for 1 year. Cars are needed for use in Glycerin service.
- 15-20, 29K 117R Tanks needed off of NS or CSX in Ohio for 6-12 Months. Cars are needed for use in Ply Oil service.
- 30-50, 23.5K Any Type Tanks needed off of any class 1 in any location for 1-5Years. Cars are needed for use in Glycols service.
- 100, 30K 117J Tanks needed off of UP or BN in Midwest for 5 Years. Cars are needed for use in Diesel service. Needed in Jan
- 10, 30K 117R Tanks needed off of CSX or NS in Southeast for 6 Months. Cars are needed for use in Crude service. Needed in Jan
- 20, 28K 117J Tanks needed off of CSX or NS in Midwest for 12 Months. Cars are needed for use in Crude service. Needed in Jan
- 50, 30K 117R/117J Tanks needed off of CSX in Northeast for 5 Year. Cars are needed for use in Refined Fuels service.
- 12, 28.3K Any Type Tanks needed off of UP or BN in Houston for 2Year. Cars are needed for use in Lube Oil service.
- 20, 30K 117J Tanks needed off of UP or BN in Midwest for 5 Years. Cars are needed for use in Ethanol service.
- 100, 30K 117J Tanks needed off of BN in Montana for 2 years. Cars are needed for use in Crude service.
- 10, 25.5K Any Type Tanks needed off of CSX in Florida for 2 Years. Cars are needed for use in UCO service.
- 10, 25.5K Any Type Tanks needed off of Any Class 1 in Any Location for 3-12 months. Cars are needed for use in Asphalt service.
- 20, 30K Any Type Tanks needed off of various class 1s in various locations for 1-5 years. Cars are needed for use in Condensate service.
- 6, 30K 117R or 117J Tanks needed off of Any Class 1 in USA for 1 year. Cars are needed for use in Av Gas service.
- 10, 25.5K-30K 117R or 117J Tanks needed off of UP or BN in Texas for 1 year. Cars are needed for use in Dicyclopentadiene service.
- 70, 30K DOT 117R/ DOT 117J Tanks needed off of UP in Corpus Christi for 5 Year. Cars are needed for use in Gasoline service.
Sales Bids
- 28, 3400CF Covered Hoppers needed off of UP BN in Texas. Cars are needed for use in Cement service. Cement Gates needed.
- 20, 17K DOT111 Tanks needed off of various class 1s in various locations. Cars are needed for use in corn syrup service.
Lease Offers
- 60, 4750, Covered Hoppers located off of UP or BN in Eads, CO. Cars are clean UP to 5 Years, 3 Hopper, Gravity Gate, Trough Hatches
- 50, 33K, 400W Pressure Tanks located off of All Class 1s in Chicago. Cars were last used in Propylene. 1 Year Term
- 50, 29K , DOT 111 Tanks located off of CN in Hamilton, ON. Cars were last used in Biodiesel. 1 year +
- 20-25, 30K, 117J Tanks located off of BNSF in West Texas. Cars were last used in Ethanol. 1 year minimum
- 24, 25.5K-30K, DOT 111 Tanks located off of UP or BN in Texas. Cars were last used in Base Oils. 1-2 Year
- 50, 33K, 400W Pressure Tanks located off of All Class 1s in US and Canada. Cars were last used in Propane. Summer or Longer Lease Available.
- 100, 6250, Covered Hoppers located off of UP in US . Cars were last used in DDG. 1 Year term. Dirty to Dirty. Free move on UP.
- 25-50, 19.6K, DOT 111 Tanks located off of UP in US. Cars were last used in Molases .
Sales Offers
- 21, 50′, Plate C Boxcars located off of various class 1s in NM. End of Life
- 3, 50′, Plate C Boxcars located off of various class 1s in multiple locations. End of Life
- 27, 50′, Plate C Boxcars located off of various class 1s in PQ. End of Life
- 100-300, 3250, Covered Hoppers located off of various class 1s in multiple locations. Sand Cars
- 5, 2740, Mill Gondolas located off of various class 1s in NC. End of Life
- 1, 2260, Mill Gondolas located off of various class 1s in AL. End of Life
- 30, 2740, Mill Gondolas located off of various class 1s in multiple locations. End of Life
- 21, 2740, Mill Gondolas located off of various class 1s in WA. End of Life
- 15, 4750, Covered Hoppers located off of various class 1s in multiple locations. End of Life
- 5, 4750, Covered Hoppers located off of various class 1s in multiple locations. End of Life
- 50-100, 31.8K, CPC 1232 Tanks located off of UP or BN in TX. Requal Due in 2025
Call PFL today to discuss your needs and our availability and market reach. Whether you are looking to lease cars, lease out cars, buy cars, or sell cars call PFL today at 239-390-2885
Live Railcar Markets
| CAT | Type | Capacity | GRL | QTY | LOC | Class | Prev. Use | Offer | Note |
|---|
PFL will be at the Following Conferences

- Where: Calgary
- Attending: David Cohen (954-729-4774), Curtis Chandler(239-405-3365), Cyndi Popov (403-402-5043)

- Where: Grand Geneva Resort
- Attending: Brian Baker (239.297.4519)
- Conference Website

- Where: Loews Arlington Hotel
- Attending: Brian Baker (239.297.4519), David Cohen (954-729-4774), and Curtis Chandler (239-405-3365)
- Conference Website

- Where: The Westin Galleria Dallas
- Attending: David Cohen (954-729-4774), and Curtis Chandler (239-405-3365)
- Conference Website

- Where: The Westin Galleria Dallas
- Attending: Brian Baker (239.297.4519)
- Conference Website