
“What really counts are good endings, not flawed beginnings.”
– Ibn Taymiyyah
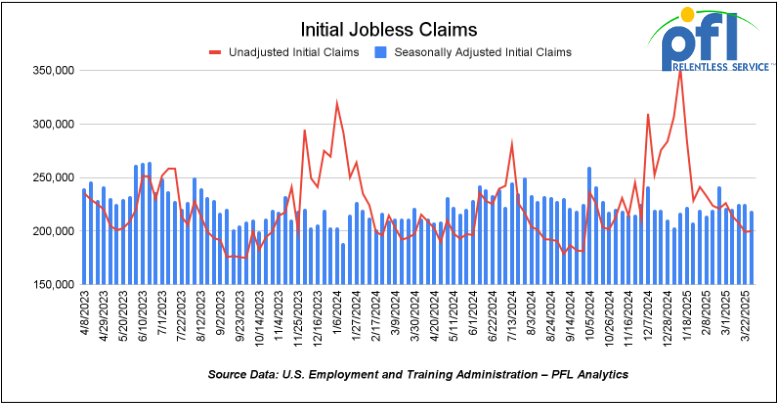
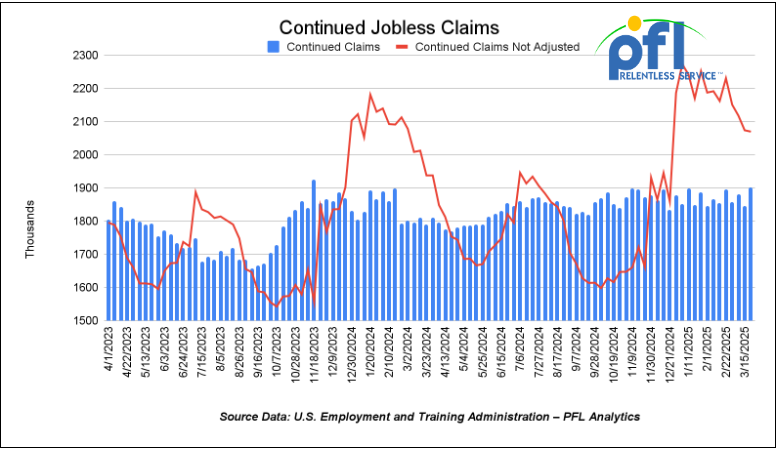
Jobs Update
- Initial jobless claims seasonally adjusted for the week ending March 29th came in at 219,000, down 6,000 people week-over-week.
- Continuing jobless claims came in at 1.903 million people, versus the adjusted number of 1.847 million people from the week prior, up 56,000 people week-over-week.
Stocks closed lower on Friday of last week and lower week over week
The DOW closed lower on Friday of last week, down 2,231.07 points (-5.5%) and closing out the week at 38,314.86, down -3,268.73 points week-over-week. The S&P 500 closed lower on Friday of last week, down -322.44 points, and closed out the week at 5,074.08, down -506.82 points week-over-week. The NASDAQ closed lower on Friday of last week, down 962.82 points (-5.56%), and closed out the week at 15,587.79, down -1,735.20 points week-over-week.
As promised, President Trump implemented sweeping tariffs on most imports, triggering a massive shock to Wall Street and Corporate America. The tariffs were more extreme than many expected, erasing some $6 trillion dollars in value from the U.S. stock market in just a few days last week. The retaliation by trading partners has only just begun, starting with China’s decision to apply a 34% tariff on all imports from the U.S., including soybeans it buys from American farmers – it bought $15b worth in 2023, according to the Observatory of Economic Complexity (OEC). The U.S. also sells China billions worth of aircraft parts, semiconductors, crude oil, vaccines, and so on, amounting to total exports (in 2023) of $154b. Still, that’s a lot less than the $436b that China sells to the U.S., an imbalance that Trump has long labeled an unfair exploitation. Leading imports from China include mobile phones, computers, batteries, and low-value manufacturing products like toys. Retaliation from other major trading partners, including the European Union, will likely follow.
U.S. railroad stocks were not immune to the Wall Street carnage. The UP, CSX, and NS lost at least 6% of their value just last week. No further transborder tariffs were announced last week and reassured investors about Canadian railroads – amid the broader financial carnage, CN stock fell just 1% and CPKC stock actually increased.
In overnight trading, DOW futures traded lower and are expected to open at 37,319 this morning down 1,211 points from Friday’s close.
Crude oil closed lower on Friday of last week and lower week over week.
West Texas Intermediate (WTI) crude closed down $4.78 per barrel (-6.64%), to close at $66.95 per barrel on Friday of last week, down $2.41 per barrel week over week. Brent traded down $4.81 USD per barrel (-6.42%) on Friday of last week, to close at $70.14 per barrel, down $3.49 per barrel week-over-week.
One Exchange WCS (Western Canadian Select) for May delivery settled on Friday of last week at US$9.00 below the WTI-CMA (West Texas Intermediate – Calendar Month Average). The implied value was US$57.29 per barrel.
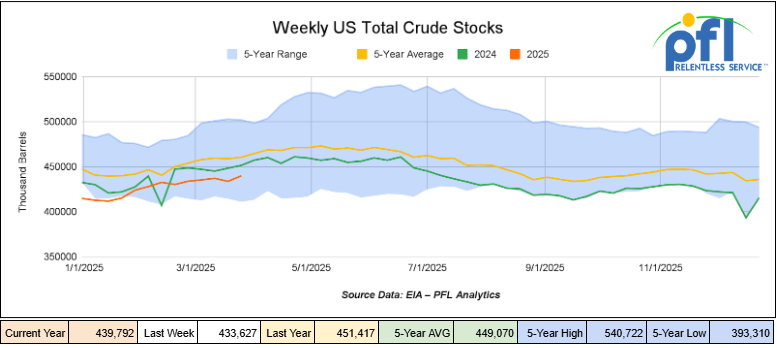
U.S. commercial crude oil inventories (excluding those in the Strategic Petroleum Reserve) increased by 6.2 million barrels week-over-week. At 439.8 million barrels, U.S. crude oil inventories are 4% below the five-year average for this time of year.
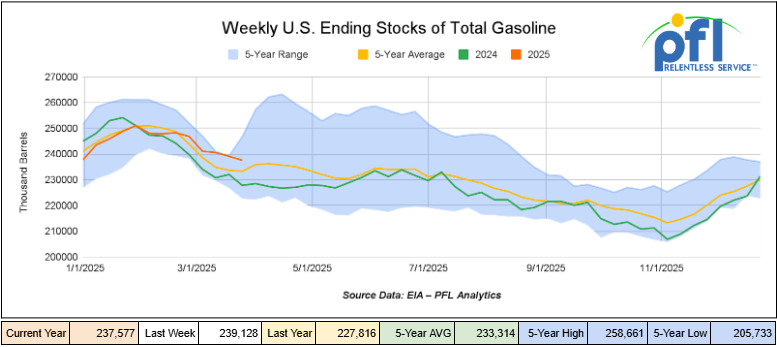
Total motor gasoline inventories decreased by 1.6 million barrels week-over-week and are 2% above the five-year average for this time of year.
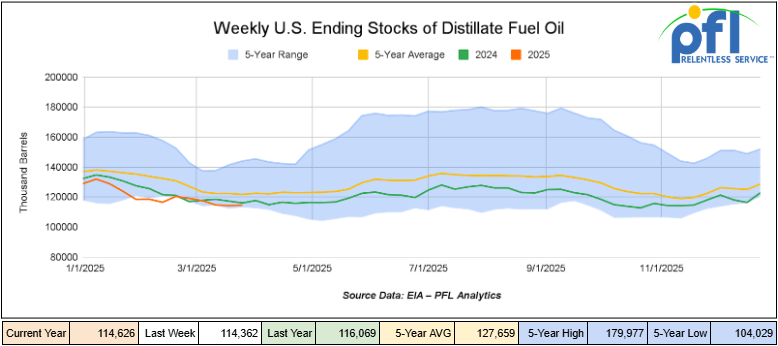
Distillate fuel inventories increased by 300,000 barrels and are about 6% below the five-year average for this time of year.
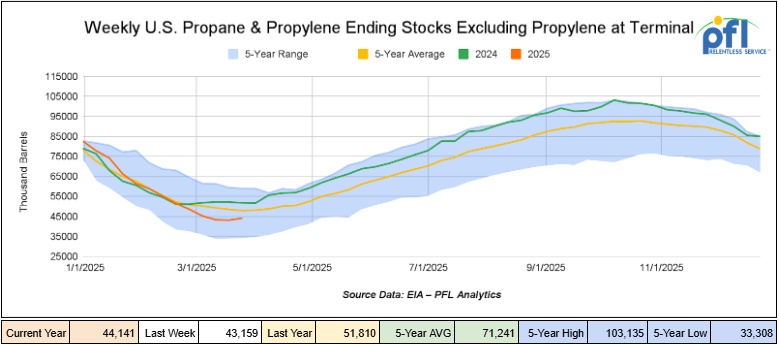
Propane/propylene inventories increased by 1 million barrels week-over-week and are 8% below the five-year average for this time of year.
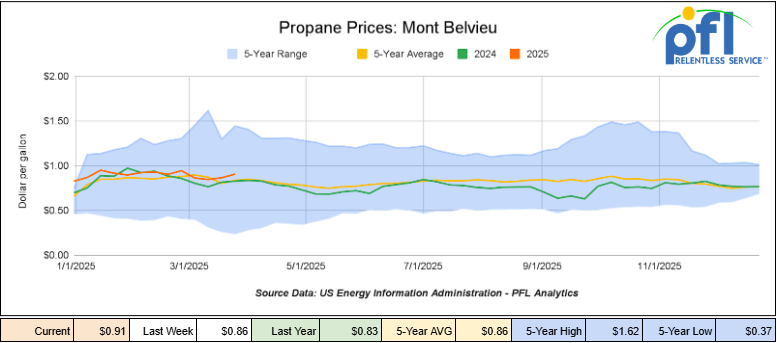
Propane prices closed at 91 cents per gallon on Friday of last week, up 5 cents per gallon week-over-week, and up 8 cents per gallon year-over-year before collapsing in late day trading activity trading as low as 78 cents per gallon.
Overall, total commercial petroleum inventories increased by 5.4 million barrels during the week ending March 28, 2025.
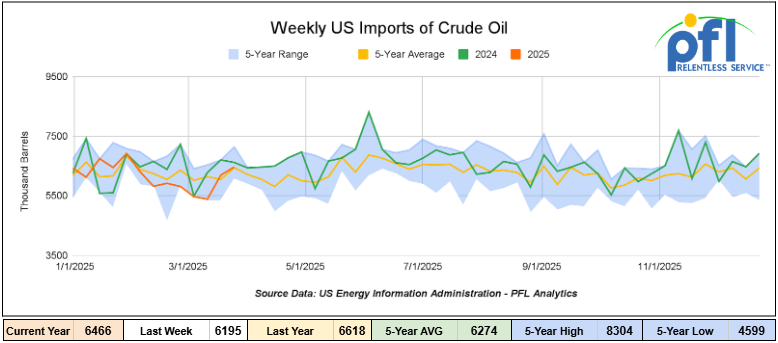
U.S. crude oil imports averaged 6.5 million barrels per day during the week ending March 28, 2025, an increase of 271,000 barrels per day week-over-week. Over the past four weeks, crude oil imports averaged 5.9 million barrels per day, 6.3% less than the same four-week period last year. Total motor gasoline imports (including both finished gasoline and gasoline blending components) averaged 748,000 barrels per day, and distillate fuel imports averaged 149,000 barrels per day during the week ending March 28, 2025.
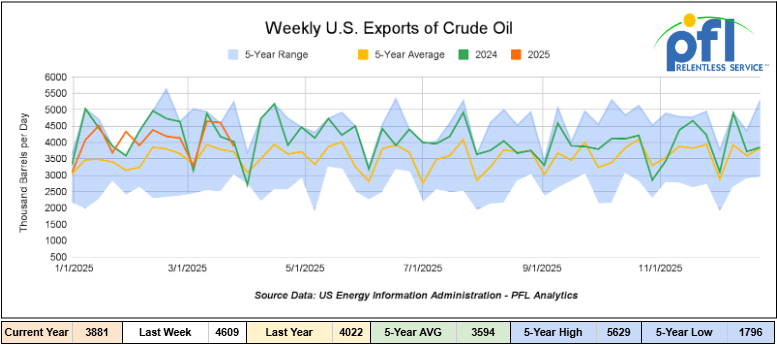
U.S. crude oil exports averaged 3.881 million barrels per day during the week ending March 28, 2025, a decrease of 728,000 barrels per day week-over-week. Over the past four weeks, crude oil exports averaged 4.106 million barrels per day.
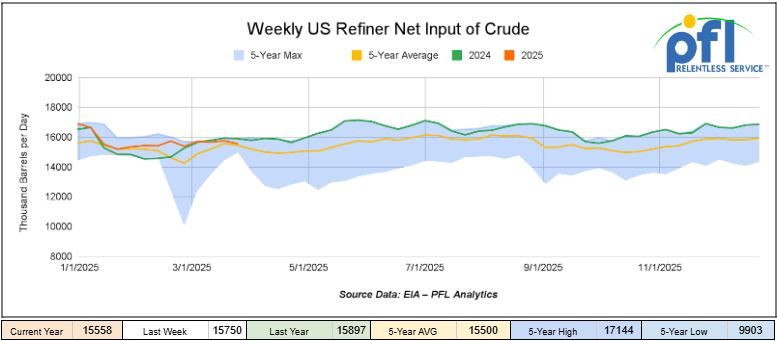
U.S. crude oil refinery inputs averaged 15.6 million barrels per day during the week ending March 28, 2025, which was 192,000 barrels per day less week-over-week.
WTI is poised to open at $59.67, down $2.32 per barrel from Friday’s close.
North American Rail Traffic
Week Ending April 2, 2025.
Total North American weekly rail volumes were up (7.6%) in week 14, compared with the same week last year. Total carloads for the week ending on April 2 were 366,692, up (6.72%) compared with the same week in 2024, while weekly intermodal volume was 344,643, up (8.55%) compared to the same week in 2024.
9 of the AAR’s 11 major traffic categories posted year-over-year increases. The largest increase came from Coal which was up (21.63%) while the largest decrease was from Forest Products which was down (-4.72%)
In the East, CSX’s total volumes were up (6.39%), with the largest decrease coming from Forest Products (-10.2%) while the largest increase came from Metallic Ores and Metals (19.63%). NS’s volumes were up (10.01%), with the largest increase coming from Grain (20.53%) while the largest decrease came from Petroleum and Petroleum Products (-9.48%).
In the West, BN’s total volumes were up (6.57%), with the largest increase coming from Motor Vehicles and Parts (30.21%) while the largest decrease came from Metallic Ores and Metals (-16.41%). UP’s total rail volumes were up (8.88%), with the largest increase coming from Nonmetallic MineralsCoal (39.49%), while the largest decrease came from Forest Products (-12.51%).
In Canada, CN’s total rail volumes were up (1.13%) with the largest increase coming from Grain, up (+109.45%), while the largest decrease came from Intermodal Units (-18.49%). CP’s total rail volumes were up (6.41%) with the largest increase coming from Other (+307.14%), while the largest decrease came from Farm Products (-30.29%).
KCS’s total rail volumes were up (14.73%) with the largest increase coming from Motor Vehicles and Parts (+62.14%), while the largest decrease came from Metallic Ores and Metals (-3.2%).
Source Data: AAR – PFL Analytics
Rig Count
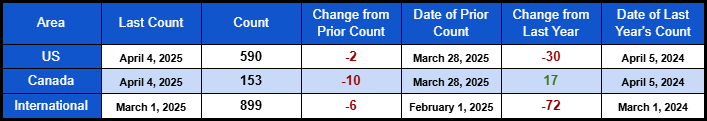
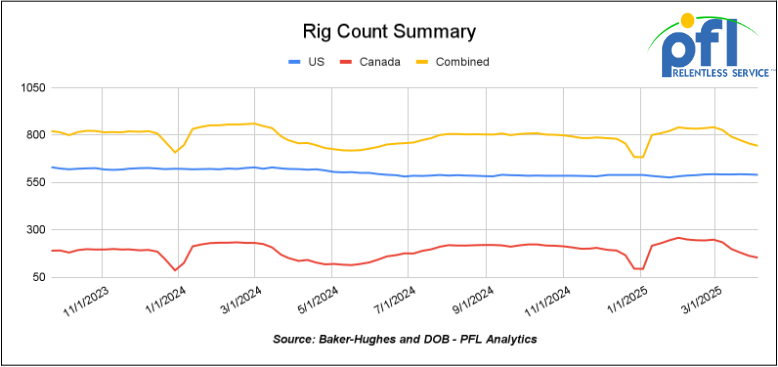
North American rig count was down by -12 rigs week-over-week. U.S. rig count was down -2 rigs week over week and down by -30 rigs year-over-year. The U.S. currently has 590 active rigs. Canada’s rig count was down -10 rigs week-over-week, but up by 17 rigs year-over-year. Canada currently has 153 active rigs. Overall, year over year we are down by -13 rigs collectively.
International Rig Count was down by -6 rigs month over month and down -72 rigs year-over-year. Internationally, there are 899 active rigs.
North American Rig Count Summary
A few things we are watching:
PFL Attended April WCRTC Event
PFL had the opportunity to attend the Western Canadian Rail & Transportation Club’s (WCRTC) spring networking event in Calgary, Alberta Canada on Thursday of last week. Cyndi Popov from PFL’s Calgary office was in attendance. The event brought together people from across the rail and transportation sectors in a relaxed, collaborative atmosphere where meaningful conversations and new connections were made. Canada’s version of the Traffic club in Chicago!
Cyndi said, “it was a great chance to meet new contacts and reconnect with existing partners. Strengthening these relationships is essential to supporting the evolving needs of those directly navigating the challenges of the rail industry. By engaging with both seasoned industry leaders and emerging voices, we stay ahead of market shifts and spot new opportunities for collaboration and growth.” It was an event where many had frustrations and challenges in navigating its supply and transportation chains in a very volatile market environment.
Fleet strategies and equipment needs seemed to be the most concern out there with market participants not wanting to have too many cars but at the same time don’t want to be short either – it is always a balance that is hard to nail down. There are also quite a few plant turnarounds that are needing logistical attention, an area where PFL thrives offering cleaning and storage solutions on both sides of the border.
The event allowed PFL the opportunity to listen, learn, and share how we’re helping clients to continue to navigate the fast-moving rail landscape and continue to deliver creative, client-focused solutions.
If you are interested in learning more about the Western Canadian Rail & Transportation Club’s meeting feel free to reach out to PFL. We serve you on both sides of the border offering comprehensive railcar solutions – call PFL today at 239-390-2885.
We are watching Petroleum Carloads
The four-week rolling average of petroleum carloads carried on the six largest North American railroads rose to 27,982 from 28,302 which was a decrease of 320 rail cars week-over-week. Canadian volumes were lower. CPKC’s shipments were lower by -9.5% week over week, CN’s volumes were lower by -2.1% week-over-week. U.S. shipments were mostly lower. The UP had the largest percentage decrease and was down by -9.5%. The BN was the sole gainer and was up by +12.2%
We continue to watch Liquefied Petroleum Gas
Offshore Liquefied Petroleum Gas (“LPG”) projects are becoming an increasingly important part of the U.S. energy sector. With several projects progressing along the Gulf Coast, the demand for rail services is expected to grow, offering new opportunities for rail shippers. The latest updates from April highlight how offshore LPG projects are advancing and creating new possibilities for the rail industry, especially considering recent significant developments.
Offshore LPG Projects Gaining Momentum:
As of April 2025, several offshore LPG export terminals in the Gulf of Mexico are making significant strides. These projects aim to meet the growing global demand for U.S. LPG’s, particularly in Asia and Europe. The U.S. is increasingly seen as a major supplier of LPG, driven by the global shift toward cleaner energy.
Offshore LPG Platform

Source Data: Petronas – PFL Analytics
Several key developments are accelerating the growth of offshore LPG:
- Gulf of Mexico Lease Sale: The U.S. Interior Department announced plans for an oil and gas lease sale in the Gulf of Mexico scheduled for June 2025. This sale, the first under the five-year leasing plan established in 2023, will open new offshore areas for oil and gas exploration, including LPG production. This is expected to increase the volume of U.S. energy exports, including LPG, and further enhance the Gulf’s role in the global energy market. The lease sale could potentially attract significant investment, further boosting offshore LPG activity.
- Panama Canal LPG Pipeline Project: The Panama Canal Authority initiated a bidding process for the construction of a new LPG pipeline across the canal, aimed at easing congestion and improving the efficiency of LPG transport between vessels. This project is a direct response to the increasing demand for U.S. LPG, particularly in markets like Asia and Europe. The pipeline is expected to streamline transportation, making it easier to move large quantities of LPG more efficiently. This development will positively impact rail shippers, as it will likely reduce transportation costs and improve logistics for moving LPG-related materials and equipment to and from export terminals.
What This Means for Rail Shippers and Railcar Manufacturers:
The expansion of offshore LPG projects brings a wealth of opportunities. As terminals and export facilities take shape, the need to transport large, specialized equipment will only increase.
It’s not just about moving equipment. The increase in offshore LPG activity will also create a demand for railcar manufacturers to design and build specialized cars that can safely transport heavy and oversized loads.
Opportunities for Parts Makers:
Parts makers are set to play a significant role in supporting offshore LPG projects as well. Since many of the railcars transporting equipment for these projects will need to be specially designed or modified, parts makers will be in demand to supply the components required.
Offshore LPG and Rail’s Future:
Offshore LPG projects are on track for continued growth as demand for cleaner energy rises globally. This means that rail shippers can expect a steady flow of work in the years to come. The development of new offshore terminals and export facilities will require rail to move essential materials, and rail companies that can provide the specialized services needed will be in high demand.
We are Watching Key Economic Indicators
U.S. Unemployment
Total nonfarm payroll employment increased by 228,000 in March, following revised gains of 117,000 in February and 307,000 in December. The unemployment rate edged up to 4.2% from 4.1% in February. Job gains were concentrated in healthcare, social assistance, transportation and warehousing, and retail trade, while federal government employment declined.

Purchasing Managers Index ( PMI)
In March 2025, the U.S. Manufacturing Purchasing Managers’ Index (PMI) declined to 49.0%, down from 50.3% in February, indicating a contraction in the manufacturing sector. This downturn reverses the modest expansions observed in January and February 2025. The decline is attributed to decreased new orders, production, and employment, with businesses expressing concerns over the impact of recent tariffs.
The Services PMI, as reported by the Institute for Supply Management (ISM), fell to 50.8% in March from 53.5% in February, marking the lowest reading since June of the previous year. This decrease suggests a significant slowdown in the services sector’s expansion, with businesses citing uncertainties related to government spending cuts and the impending tariffs as contributing factors.
Conversely, data from S&P Global presents a more optimistic view, indicating that the Services PMI increased to 54.3% in March from 51.0% in February, signaling a stronger expansion in the services sector.
The imposition of tariffs on goods from Canada, Mexico, and China has introduced uncertainties, with businesses expressing concerns about higher raw material costs and potential supply chain disruptions. These developments could influence future business activities across both the manufacturing and services sectors.

Lease Bids
- 10, 2500CF Open Top Hoppers needed off of UP or BN in Texas for 5 years. Cars are needed for use in aggregate service. Need Rapid Discharge Doors
- 25, 3230 PD Hoppers needed off of NS or CSX in Ohio for 5 years. Cars are needed for use in Flyash service.
- 100, 5200 Covered Hoppers needed off of UP or BN in Northwest for 6 month. Cars are needed for use in Pet Coke service. Roud Hatch, Bottom Outlet Doors
- 100, 4750 Covered Hoppers needed off of UP or BN in Texas for 1-5 Years. Cars are needed for use in Petcoke service.
- 50, 23.5-25.5 DOT111 Tanks needed off of Any Class 1 in USA for 5 years. Cars are needed for use in Asphalt service.
- 20, 25.5k CPC 1232 Tanks needed off of UP, BN, CSX, NS in OK, TX, Northeast for 3 Year. Cars are needed for use in Asphalt service.
- 10, 30K 117R or 117J Tanks needed off of Any Class 1 in USA for 1 year. Cars are needed for use in Glycerin service.
- 15-20, 29K 117R Tanks needed off of NS or CSX in Ohio for 6-12 Months. Cars are needed for use in Ply Oil service.
- 30-50, 23.5K Any Type Tanks needed off of any class 1 in any location for 1-5Years. Cars are needed for use in Glycols service.
- 10, Any Size Stainless Steel DOT111 Tanks needed off of UP or BN in TX for 1-5 Years. Cars are needed for use in Refined Products service.
- 100, 30K 117J Tanks needed off of UP or BN in Midwest for 5 Years. Cars are needed for use in Diesel service. Needed in Jan
- 10, 30K 117R Tanks needed off of CSX or NS in Southeast for 6 Months. Cars are needed for use in Crude service. Needed in Jan
- 20, 28K 117J Tanks needed off of CSX or NS in Midwest for 12 Months. Cars are needed for use in Crude service. Needed in Jan
- 50, 30K 117R/117J Tanks needed off of CSX in Northeast for 5 Year. Cars are needed for use in Refined Fuels service.
- 12, 28.3K Any Type Tanks needed off of UP or BN in Houston for 2Year. Cars are needed for use in Lube Oil service.
- 20, 30K 117J Tanks needed off of UP or BN in Midwest for 5 Years. Cars are needed for use in Ethanol service.
- 100, 30K 117J Tanks needed off of BN in Montana for 2 years. Cars are needed for use in Crude service.
- 10, 25.5K Any Type Tanks needed off of CSX in Florida for 2 Years. Cars are needed for use in UCO service.
- 10, 25.5K Any Type Tanks needed off of Any Class 1 in Any Location for 3-12 months. Cars are needed for use in Asphalt service.
- 20, GP Tanks needed off of various class 1s in various locations for 1-5 years.
Sales Bids
- 28, 3400CF Covered Hoppers needed off of UP BN in Texas. Cars are needed for use in Cement service. Cement Gates needed.
- 20, 17K DOT111 Tanks needed off of various class 1s in various locations. Cars are needed for use in corn syrup service.
Lease Offers
- 60, 4750, Covered Hoppers located off of UP or BN in Eads, CO. Cars are clean UP to 5 Years, 3 Hopper, Gravity Gate, Trough Hatches
- 50, 33K, 400W Pressure Tanks located off of All Class 1s in Chicago. Cars were last used in Propylene. 1 Year Term
- 50, 29K , DOT 111 Tanks located off of CN in Hamilton, ON. Cars were last used in Biodiesel. 1 year +
- 39, 30K, 117R Tanks located off of CN, NS, CSX in Detroit. Cars were last used in Diesel. 5 Years; Mid 2029 Return
- 20-25, 30K, 117J Tanks located off of BNSF in West Texas. Cars were last used in Ethanol. 1 year minimum
- 24, 25.5K-30K, DOT 111 Tanks located off of UP or BN in Texas. Cars were last used in Base Oils. 1-2 Year
Sales Offers
- 21, 50′, Plate C Boxcars located off of various class 1s in NM. End of Life
- 3, 50′, Plate C Boxcars located off of various class 1s in multiple locations. End of Life
- 27, 50′, Plate C Boxcars located off of various class 1s in PQ. End of Life
- 100-300, 3250, Covered Hoppers located off of various class 1s in multiple locations. Sand Cars
- 5, 2740, Mill Gondolas located off of various class 1s in NC. End of Life
- 1, 2260, Mill Gondolas located off of various class 1s in AL. End of Life
- 30, 2740, Mill Gondolas located off of various class 1s in multiple locations. End of Life
- 21, 2740, Mill Gondolas located off of various class 1s in WA. End of Life
- 15, 4750, Covered Hoppers located off of various class 1s in multiple locations. End of Life
- 5, 4750, Covered Hoppers located off of various class 1s in multiple locations. End of Life
- 50-100, 31.8K, CPC 1232 Tanks located off of UP or BN in TX. Requal Due in 2025
Call PFL today to discuss your needs and our availability and market reach. Whether you are looking to lease cars, lease out cars, buy cars, or sell cars call PFL today at 239-390-2885
Live Railcar Markets
| CAT | Type | Capacity | GRL | QTY | LOC | Class | Prev. Use | Offer | Note |
|---|
PFL will be at the Following Conferences

- Where: Calgary
- Attending: David Cohen (954-729-4774), Curtis Chandler(239-405-3365), Cyndi Popov (403-402-5043)

- Where: Grand Geneva Resort
- Attending: Brian Baker (239.297.4519)
- Conference Website

- Where: Loews Arlington Hotel
- Attending: Brian Baker (239.297.4519), David Cohen (954-729-4774), and Curtis Chandler (239-405-3365)
- Conference Website

- Where: The Westin Galleria Dallas
- Attending: David Cohen (954-729-4774), and Curtis Chandler (239-405-3365)
- Conference Website

- Where: The Westin Galleria Dallas
- Attending: Brian Baker (239.297.4519)
- Conference Website