
“The fruit of your own hard work is the sweetest.” – Deepika Padukone
Jobs Update
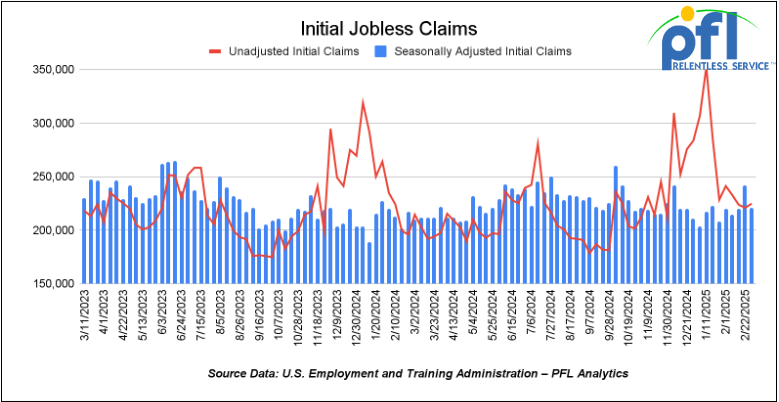
- Initial jobless claims seasonally adjusted for the week ending March 1st came in at 221,000, down -21,000 people week-over-week.
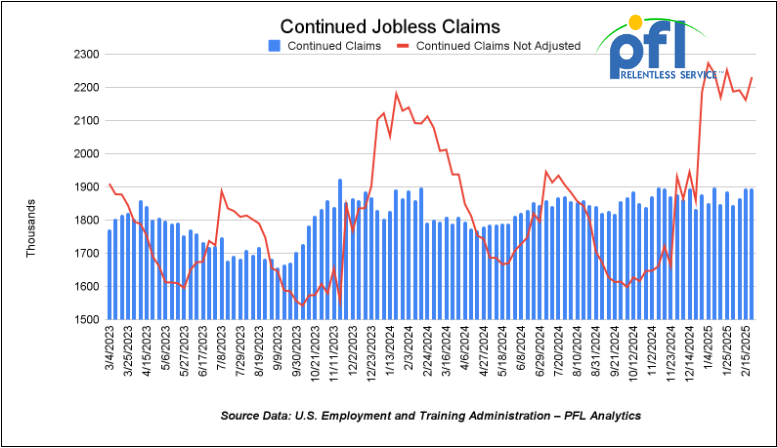
- Continuing jobless claims came in at 1.897 million people, versus the adjusted number of 1.855 million people from the week prior, down up 42,000 people week-over-week.
Stocks closed higher on Friday of last week, but lower week over week
The DOW closed higher on Friday of last week, up 222.64 points (0.52%) and closing out the week at 42,801.72, down -1,039.19 points week-over-week. The S&P 500 closed higher on Friday of last week, up 31.68 points, and closed out the week at 5,770.2, down -184.3 points week-over-week. The NASDAQ closed higher on Friday of last week, up 126.96 points (0.67%), and closed out the week at 18,196.22, down -651.06 points week-over-week.
In overnight trading, DOW futures traded lower and are expected to open at 42,552 this morning down 286 points from Friday’s close.
Crude oil closed higher on Friday of last week, but lower week over week.
West Texas Intermediate (WTI) crude closed up $1.06 per barrel (1.6%), to close at $67.42 per barrel on Friday of last week, down -$2.34 per barrel week over week. Brent traded up $1.10 USD per barrel (1.58%) on Friday of last week, to close at $67.42 per barrel, down -$5.76 per barrel week-over-week.
One Exchange WCS (Western Canadian Select) for April delivery settled on Friday of last week at US$12.70 below the WTI-CMA (West Texas Intermediate – Calendar Month Average). The implied value was US$53.16 per barrel.
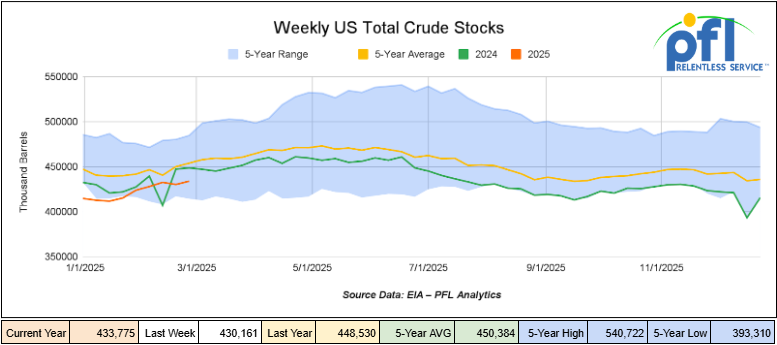
U.S. commercial crude oil inventories (excluding those in the Strategic Petroleum Reserve) increased by 3.6 million barrels week-over-week. At 433.8 million barrels, U.S. crude oil inventories are 4% below the five-year average for this time of year.
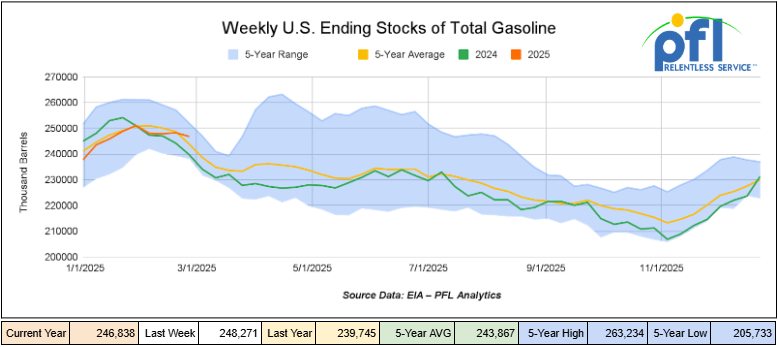
Total motor gasoline inventories decreased by 1.4 million barrels week-over-week and are 1% above the five-year average for this time of year.
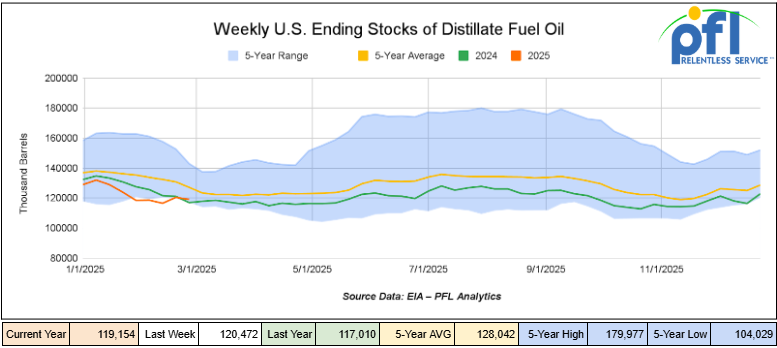
Distillate fuel inventories decreased by 1.3 million barrels week-over-week and are 6% below the five-year average for this time of year.
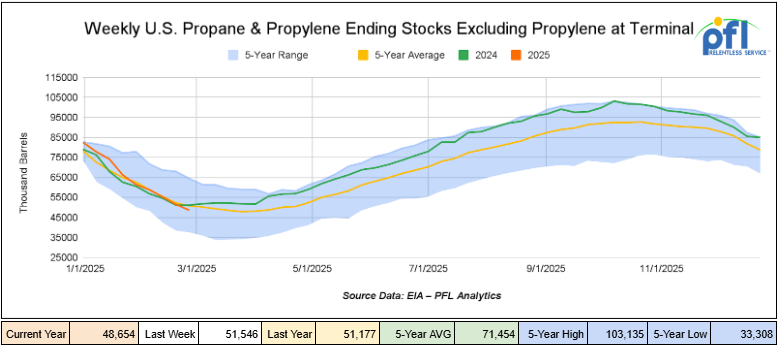
Propane/propylene inventories decreased by 2.9 million barrels week-over-week and are 4% below the five-year average for this time of year.
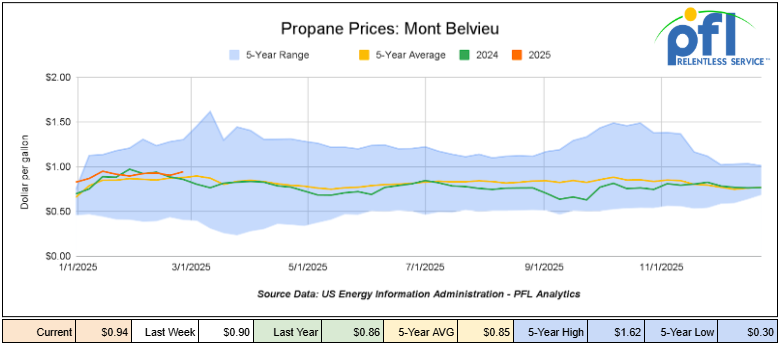
Propane prices closed at 94 cents per gallon on Friday of last week, up 4 cents per gallon week-over-week, but down 8 cents year-over-year.
Overall, total commercial petroleum inventories decreased by 4.6 million barrels during the week ending February 28th, 2025.
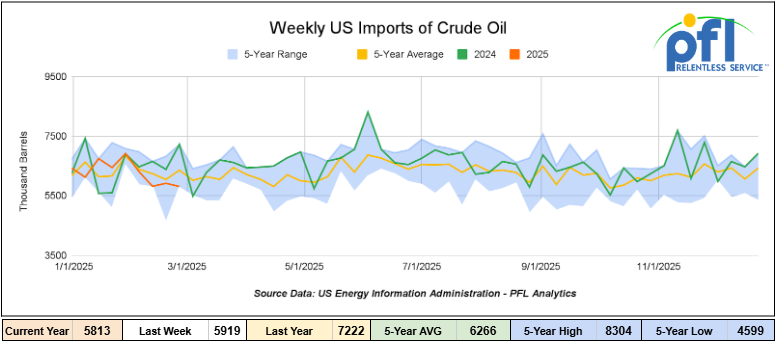
U.S. crude oil imports averaged 5.8 million barrels per day, a decrease of 106,000 barrels per day week-over-week. Over the past four weeks, crude oil imports averaged 6 million barrels per day, 10.7% less than the same four-week period last year. Total motor gasoline imports (including both finished gasoline and gasoline blending components) averaged 603,000 barrels per day, and distillate fuel imports averaged 269,000 barrels per day during the week ending February 28th, 2025.
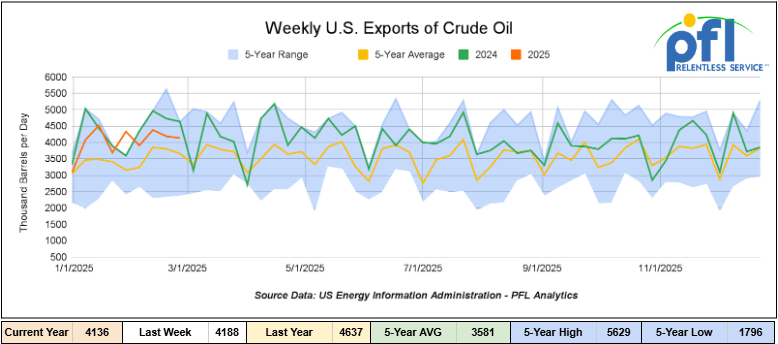
U.S. crude oil exports averaged 4.136 million barrels per day during the week ending February 28th, 2025, a decrease of 52,000 barrels per day week-over-week. Over the past four weeks, crude oil exports averaged 4.154 million barrels per day.
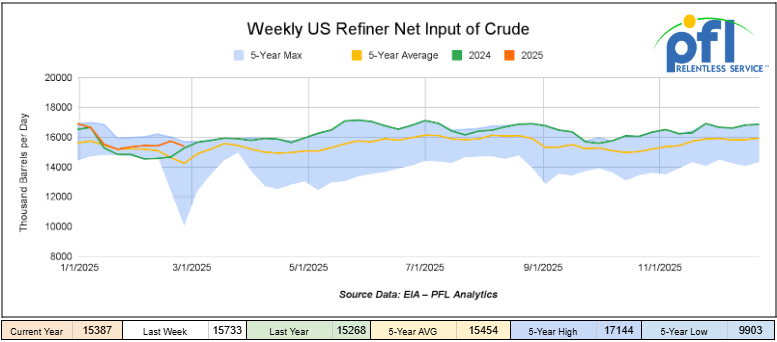
U.S. crude oil refinery inputs averaged 15.4 million barrels per day during the week ending February 28, 2025, which was 346,000 barrels per day less week-over-week.
WTI is poised to open at $67.29, up 25 cents per barrel from Friday’s close.
North American Rail Traffic
Week Ending March 5, 2025.
Total North American weekly rail volumes were up (4.32%) in week 10, compared with the same week last year. Total carloads for the week ending on March 5 were 350,501, up (1.07%) compared with the same week in 2024, while weekly intermodal volume was 352,729, up (7.76%) compared to the same week in 2024.
8 of the AAR’s 11 major traffic categories posted year-over-year increases. The largest increase came from Intermodal Units which was up (7.76%) while the largest decrease was from Nonmetallic Minerals which was down (-4.86%)
In the East, CSX’s total volumes were up (1.42%), with the largest decrease coming from Coal (-7.16%) while the largest increase came from Grain (34.24%). NS’s volumes were up (5.25%), with the largest increase coming from Forest Products (16.59%) while the largest decrease came from Other (-12.91%).
In the West, BN’s total volumes were up (5.07%), with the largest increase coming from Intermodal Units(9.08%) while the largest decrease came from Metallic Ores and Metals (-16.59%). UP’s total rail volumes were up (7.57%), with the largest increase coming from Grain (19.31%), while the largest decrease came from Other (-14.18%).
In Canada, CN’s total rail volumes were down (-1.95%) with the largest increase coming from Other, up (+39.37%), while the largest decrease came from Intermodal (-28.28%). CP’s total rail volumes were down (-16.35%) with the largest increase coming from Other (+51.72%), while the largest decrease came from Grain (-45.28%). KCS’s total rail volumes were up (12.51%) with the largest increase coming from Motor Vehicles and Parts (+30.97%), while the largest decrease came from Grain (-19.85%).
Source Data: AAR – PFL Analytics
Rig Count
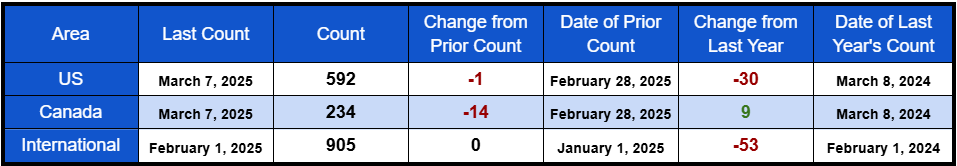
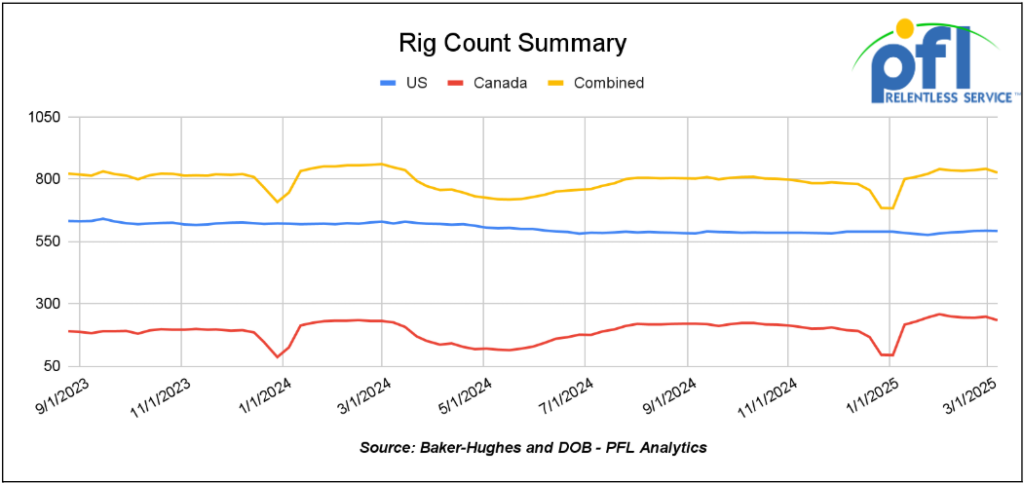
North American rig count was down by -15 rigs week-over-week. U.S. rig count was down by -1 rig week over week, but down by -30 rigs year-over-year. The U.S. currently has 592 active rigs. Canada’s rig count was down 14 rigs week-over-week, but up by 9 rigs year-over-year, and Canada’s overall rig count is 234 active rigs. Overall, year over year we are down by -21 rigs collectively.
International rig count which is reported monthly was flat month-over-month, but down 53 rigs year-over-year. Internationally there are 905 active rigs.
North American Rig Count Summary
A few things we are watching:
We are watching Petroleum Carloads
The four-week rolling average of petroleum carloads carried on the six largest North American railroads fell to 28,289 from 28,609 which was a decrease of 320 rail cars week-over-week. Canadian volumes were higher. CPKC’s shipments were higher by +4.4% week over week, CN’s volumes were higher by +12.7% week-over-week. U.S. shipments were mixed. The BN had the largest percentage increase and was up by 22.6%. The CSX had the largest percentage decrease and was down -5.1%.
We are watching the Trump Administration
Between the Canadian tariff drama, fears of OPEC+ production returning to markets, Trump’s maximum pressure on Iran and a US-China trade war, last week seemed to have it all. It is hard to keep up with the news cycle, not even the Liberal media outlets can, as the cycle changes daily as Trump is firing from all angles. Oil prices tumbled through the week, but then started to recover early on Friday morning of last week. With flattening backwardation, it prompted the Saudis to cut prices.
Notable Items to report:
Tariffs with Mexico and Canada
Trump backed off on implementing certain Tariffs on Canada and Mexico until April 2nd. It is unclear why he did this. Was he concerned that it would have an impact at the pump? Was he secretly worried about retaliation efforts from Mexico or Canada, and particularly Canada?
Ontario will charge 25% more for electricity shipped to 1.5 million Americans starting today in response to Trump’s tariffs, Premier Doug Ford said on Thursday of last week. Ontario provides electricity to Minnesota, New York and Michigan. Earlier last week, Ford warned the governors of those states about the coming changes.
Alberta Premier Danielle Smith said on Wednesday of last week that she still doesn’t support taxing or reducing oil and gas exports to the U.S., but that the province will work on building pipelines to Canada’s coasts to increase shipments to Asia and Europe.
Possibilities include a spur line off the Trans Mountain oil pipeline or a revival of the Northern Gateway crude conduit to British Columbia, Smith said. The northern territory of Nunavut is interested in developing Grays Bay for rail, road and pipeline projects, she said.
Other potential projects include an export link to Alaska and infrastructure on Hudson Bay, where ice breakers can clear a path for ships. A revival of the Energy East oil pipeline from Alberta to Canada’s east is possible if a path can be found that avoids Montreal, Smith said.
Canada’s federal and provincial governments rolled out a series of countermeasures last week in response to Trump’s tariffs, with policies targeting U.S. alcoholic beverages among the common options. Provincial governments in Canada have control over alcohol distribution and in some cases even run retail stores.
Ontario and British Columbia have already begun pulling U.S. products off those shelves.
Senate Votes to Repeal Methane Leak Fee: Positive Implications for Rail and Energy Sectors:
In a significant development for the oil and gas industry, the U.S. Senate has voted to repeal the methane leak fee, a regulation introduced by the Biden administration to curb methane emissions. The fee, originally set to commence at $900 per metric ton of methane emissions above a specific threshold and escalate to $1,500 per metric ton by 2026, was viewed as a major financial burden by industry stakeholders.
The repeal, which follows a similar resolution passed by the House of Representatives, now awaits President Donald Trump’s signature. This move is seen as a major victory for the oil and gas sector, which argued that the fee imposed excessive costs on producers. According to the Environmental Protection Agency (EPA), the industry would have faced over $560 million in fines this year due to methane leaks. However, overall compliance costs were projected to be much higher.
Potential Positive Outcomes for Rail and Energy Sectors:
PFL anticipates that the repeal of the methane leak fee will generate several positive outcomes for the rail and energy sectors. With the elimination of this fee, oil and gas producers will experience reduced regulatory expenses, allowing these companies to redirect funds toward operational enhancements. This is likely to lead to increased demand for rail transportation services to move oil and gas products more efficiently. Financial relief from the repeal will also enable oil and gas companies to invest more capital in infrastructure projects, potentially expanding rail networks and upgrading facilities to improve the transportation and storage of petroleum products. These developments could not only benefit the oil and gas industry but also create new opportunities for the rail sector.
The repeal of the methane leak fee primarily impacts the oil and gas industry, but also has positive implications for several other sectors:
- Manufacturing and Industrial Sectors: Manufacturing sectors that rely on natural gas as a key input may benefit from lower energy costs, boosting production and competitiveness.
- Construction and Infrastructure Development: The construction sector could see increased activity as oil and gas companies invest in new projects, creating job opportunities and stimulating economic growth.
We are Watching the Panama Canal
Well, folks, Trump was not kidding that we were taking over the Panama Canal. President Trump had been hammering Panama for weeks over its most valuable asset – the Panama Canal, claiming that China operated the waterway. We knew there was a deal coming with Marco Rubio visiting recently and the pressure on Panama has been intense. Well, now we know what the deal is- Private equity came in and purchased two ports off the Chinese.
An investment group led by BlackRock, said it had agreed to buy two ports in Panama owned by Hong Kong-based CK Hutchison. The ownership by CK Hutchison had become the focus of the tensions between Panama and the President.
BlackRock will buy the ports, which sit at either end of the canal, and over 40 others from the Hong Kong conglomerate for roughly $21 billion.
Additionally, it looks as though a pipeline may get built through the canal. The Panama Canal Authority is studying the possibility of constructing a 1 million barrel per day pipeline to transport LPG from the Caribbean Sea to the Pacific, with a decision expected by summer to move forward with the next steps, Administrator and CEO Ricaurte Vasquez said last week. They anticipate having an investment decision as early as this summer, he added.

Source: TradeWins – PFL Analytics
Vasquez said that a possible LPG pipeline could replace part of the product transit through the canal with LNG. The potential pipeline proposed by Vasquez was made during a presentation that he made at a Tokyo LPG conference last week and would be designed to target ethane and LPG’s coming from the U.S. Ethane demand is expected to increase in China and elsewhere and the U.S. has lots of it and it is cheap. Another good rail story. Stay tuned to PFL, we are watching this one.
We are Watching Key Economic Indicators
U.S. Unemployment
Total non-farm payroll employment increased by 151,000 in February, following revised gains of 125,000 jobs in January and 307,000 in December. The unemployment rate edged up to 4.1% from 4.0% in January. Job gains were concentrated in healthcare, financial activities, and transportation & warehousing, while retail trade and federal government employment declined.

Purchasing Managers Index ( PMI)
In February 2025, the U.S. Manufacturing Purchasing Managers’ Index (PMI) registered at 50.3%, a slight decrease from January’s 50.9%. This marks the second consecutive month of expansion following a prolonged period of contraction, indicating a modest but ongoing recovery in the manufacturing sector. These are the jobs we want,folks.
The Services PMI, as reported by the Institute for Supply Management (ISM), increased to 53.5% in February, up from 52.8% in January. This rise suggests a continued expansion in the services sector, businesses are expressing concerns about the impact of recent tariffs.
However, data from S&P Global presents a contrasting view, indicating that the Services PMI decreased to 49.7% in February from 52.9% in January, signaling a contraction in the services sector.
The imposition of tariffs on goods from Canada, Mexico, and China has introduced uncertainties, with businesses expressing concerns about higher raw material costs and potential supply chain disruptions. These developments could influence future business activities across both manufacturing and services sectors.

Lease Bids
- 10, 2500CF Open Top Hoppers needed off of UP or BN in Texas for 5 years. Cars are needed for use in aggregate service. Need Rapid Discharge Doors
- 25, 3230 PD Hoppers needed off of NS or CSX in Ohio for 5 years. Cars are needed for use in Flyash service.
- 100, 5200 Covered Hoppers needed off of UP or BN in Northwest for 6 month. Cars are needed for use in Pet Coke service. Roud Hatch, Bottom Outlet Doors
- 100, 4750 Covered Hoppers needed off of UP or BN in Texas for 1-5 Years. Cars are needed for use in Petcoke service.
- 50, 23.5-25.5 DOT111 Tanks needed off of Any Class 1 in USA for 5 years. Cars are needed for use in Asphalt service.
- 20, 25.5k CPC 1232 Tanks needed off of UP, BN, CSX, NS in OK, TX, Northeast for 3 Year. Cars are needed for use in Asphalt service.
- 10, 30K 117R or 117J Tanks needed off of Any Class 1 in USA for 1 year. Cars are needed for use in Glycerin service.
- 15-20, 29K 117R Tanks needed off of NS or CSX in Ohio for 6-12 Months. Cars are needed for use in Ply Oil service.
- 30-50, 23.5K Any Type Tanks needed off of any class 1 in any location for 1-5Years. Cars are needed for use in Glycols service.
- 10, Any Size Stainless Steel DOT111 Tanks needed off of UP or BN in TX for 1-5 Years. Cars are needed for use in Refined Products service.
- 100, 30K 117J Tanks needed off of UP or BN in Midwest for 5 Years. Cars are needed for use in Diesel service. Needed in Jan
- 10, 30K 117R Tanks needed off of CSX or NS in Southeast for 6 Months. Cars are needed for use in Crude service. Needed in Jan
- 20, 28K 117J Tanks needed off of CSX or NS in Midwest for 12 Months. Cars are needed for use in Crude service. Needed in Jan
- 50, 30K 117R/117J Tanks needed off of CSX in Northeast for 5 Year. Cars are needed for use in Refined Fuels service.
- 12, 28.3K Any Type Tanks needed off of UP or BN in Houston for 2Year. Cars are needed for use in Lube Oil service.
- 20, 30K 117J Tanks needed off of UP or BN in Midwest for 5 Years. Cars are needed for use in Ethanol service.
- 100, 30K 117J Tanks needed off of BN in Montana for 2 years. Cars are needed for use in Crude service.
- 10, 25.5K Any Type Tanks needed off of CSX in Florida for 2 Years. Cars are needed for use in UCO service.
- 10, 25.5K Any Type Tanks needed off of Any Class 1 in Any Location for 3-12 months. Cars are needed for use in Asphalt service.
- 20, GP Tanks needed off of various class 1s in various locations for 1-5 years.
Sales Bids
- 28, 3400CF Covered Hoppers needed off of UP BN in Texas. Cars are needed for use in Cement service. Cement Gates needed.
- 20, 17K DOT111 Tanks needed off of various class 1s in various locations. Cars are needed for use in corn syrup service.
Lease Offers
- 60, 4750, Covered Hoppers located off of UP or BN in Eads, CO. Cars are clean UP to 5 Years, 3 Hopper, Gravity Gate, Trough Hatches
- 50, 33K, 400W Pressure Tanks located off of All Class 1s in Chicago. Cars were last used in Propylene. 1 Year Term
- 50, 29K , DOT 111 Tanks located off of CN in Hamilton, ON. Cars were last used in Biodiesel. 1 year +
- 39, 30K, 117R Tanks located off of CN, NS, CSX in Detroit. Cars were last used in Diesel. 5 Years; Mid 2029 Return
- 20-25, 30K, 117J Tanks located off of BNSF in West Texas. Cars were last used in Ethanol. 1 year minimum
- 24, 25.5K-30K, DOT 111 Tanks located off of UP or BN in Texas. Cars were last used in Base Oils. 1-2 Year
Sales Offers
- 21, 50′, Plate C Boxcars located off of various class 1s in NM. End of Life
- 3, 50′, Plate C Boxcars located off of various class 1s in multiple locations. End of Life
- 27, 50′, Plate C Boxcars located off of various class 1s in PQ. End of Life
- 100-300, 3250, Covered Hoppers located off of various class 1s in multiple locations. Sand Cars
- 5, 2740, Mill Gondolas located off of various class 1s in NC. End of Life
- 1, 2260, Mill Gondolas located off of various class 1s in AL. End of Life
- 30, 2740, Mill Gondolas located off of various class 1s in multiple locations. End of Life
- 21, 2740, Mill Gondolas located off of various class 1s in WA. End of Life
- 15, 4750, Covered Hoppers located off of various class 1s in multiple locations. End of Life
- 5, 4750, Covered Hoppers located off of various class 1s in multiple locations. End of Life
- 50-100, 31.8K, CPC 1232 Tanks located off of UP or BN in TX. Requal Due in 2025
Call PFL today to discuss your needs and our availability and market reach. Whether you are looking to lease cars, lease out cars, buy cars, or sell cars call PFL today at 239-390-2885
Live Railcar Markets
| CAT | Type | Capacity | GRL | QTY | LOC | Class | Prev. Use | Offer | Note |
|---|
PFL will be at the Following Conferences

- Where: Calgary
- Attending: David Cohen (954-729-4774), Curtis Chandler(239-405-3365), Cyndi Popov (403-402-5043)

- Where: Grand Geneva Resort
- Attending: Brian Baker (239.297.4519)
- Conference Website

- Where: Loews Arlington Hotel
- Attending: Brian Baker (239.297.4519), David Cohen (954-729-4774), and Curtis Chandler (239-405-3365)
- Conference Website

- Where: The Westin Galleria Dallas
- Attending: David Cohen (954-729-4774), and Curtis Chandler (239-405-3365)
- Conference Website

- Where: The Westin Galleria Dallas
- Attending: Brian Baker (239.297.4519)
- Conference Website