
“A pessimist sees the difficulty in every opportunity; an optimist sees the opportunity in every difficulty.”
-Winston Churchill
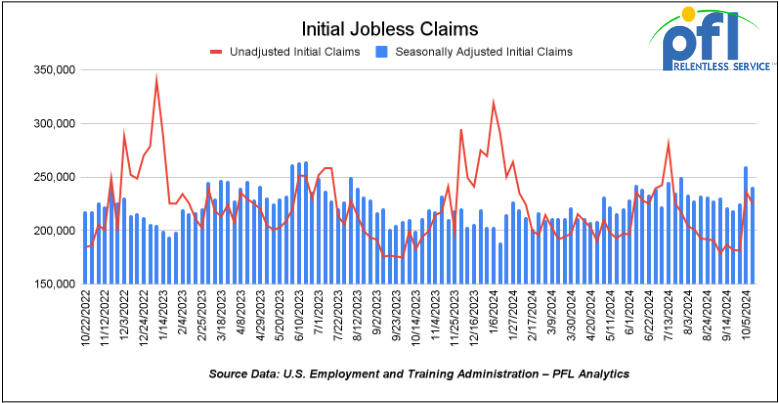
Jobs Update
- Initial jobless claims seasonally adjusted for the week ending October 12th came in at 241,000, down -19,000 people week-over-week.
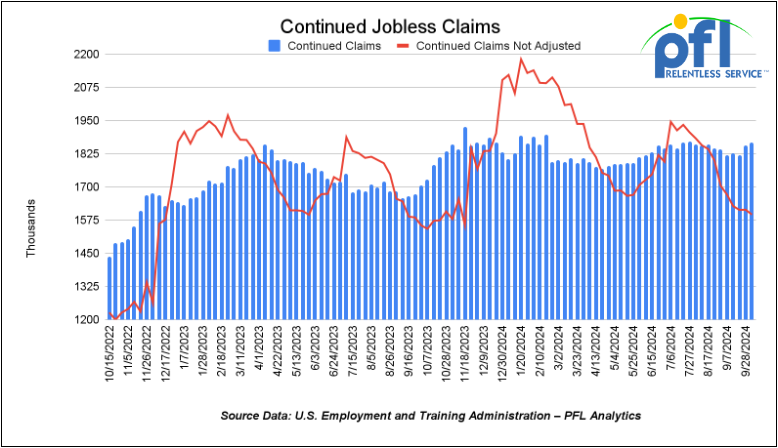
- Continuing jobless claims came in at 1.867 million people, versus the adjusted number of 1.858 million people from the week prior, up 9,000 people week-over-week.
Stocks closed higher on Friday of last week and higher week over week
The DOW closed higher, on Friday of last week up 36.86 points (0.09%), closing out the week at 43,275.91, up 412.06 points week-over-week. The S&P 500 closed higher on Friday of last week, up 23.2 points and closed out the week at 5,864.67, up 49.64 points week-over-week. The NASDAQ closed higher on Friday of last week, up 115.94 points (0.63%) and closed out the week at 18,489.55, up 146.62 points week over week.
In overnight trading, DOW futures traded lower and are expected to open at 43,485 this morning down -33 points.
Crude oil closed down on Friday of last week, and down week over week.
West Texas Intermediate (WTI) crude closed down -$1.45 per barrel (-2.05%) to close at $69.22 per barrel on Friday of last week, down -$6.34 per barrel week over week. Brent traded down -$1.39 USD per barrel (-1.87%) on Friday of last week, to close at $73.06 per barrel, down -$5.98 per barrel week-over-week.
Increasing oil and gas supplies, which are expected to come on stream over the next few years, will keep a lid on prices and lessen energy security concerns for the remainder of the decade, International Energy Agency (IEA) executive director Fatih Birol said during the launch of the IEA’s World Energy Outlook 2024 on Friday of last week.
But, there is still potential for geopolitical crises to drive volatility in markets, Birol added, with the Middle East the area of highest concern.
“What is clear is in the second half of the decade we are entering a new market context. The fundamentals of the oil and gas sector are easing,” he said. “We are moving into a much more comfortable market context.”
The prospect of more ample or even surplus supplies of oil and natural gas, depending on how geopolitical tensions evolve, “would move us into a very different energy world from the one we have experienced in recent years during the global energy crisis,” Birol added.
“It implies downward pressure on prices, providing some relief for consumers that have been hit hard by price spikes.”
On the oil side, Birol said the IEA is forecasting significant new supply coming onstream from the Americas, including the U.S., Canada, Brazil, and Guyana.
“On the demand side, last year we said we expected fossil fuel demand growth will come to an end by 2030. This year we are reconfirming that oil demand will peak before 2030. But we will still need oil for years to come. It doesn’t mean it will decline immediately.”
The rise in electric vehicles will be the main driver in curtailing oil demand, particularly in China, said Birol. Globally, the IEA expects about 20 percent of global car sales will be some form of EV this year, with 50 percent of car sales in China being EVs.
“We’re seeing EVs penetrate the car market in all key markets,” he said. “By 2030 we expect half of new car sales to be electric, resulting in substantial displacement of oil consumption compared to today.”
One Exchange WCS (Western Canadian Select) for December delivery settled Friday on last week at US$12.75 below the WTI-CMA (West Texas Intermediate – Calendar Month Average). The implied value was US$ 56.78 per barrel.
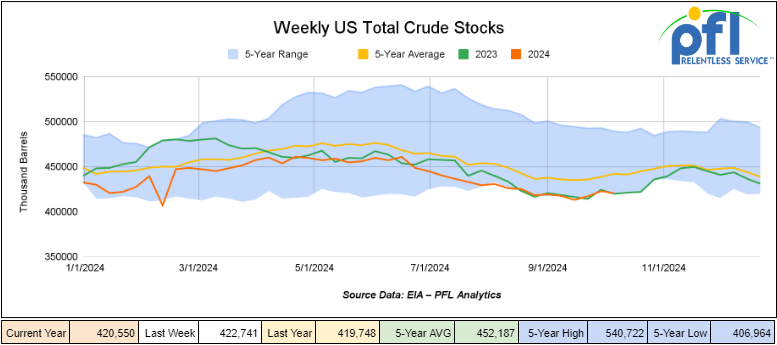
U.S. commercial crude oil inventories (excluding those in the Strategic Petroleum Reserve) decreased by 2.2 million barrels week-over-week. At 420.5 million barrels, U.S. crude oil inventories are 5% below the five-year average for this time of year.
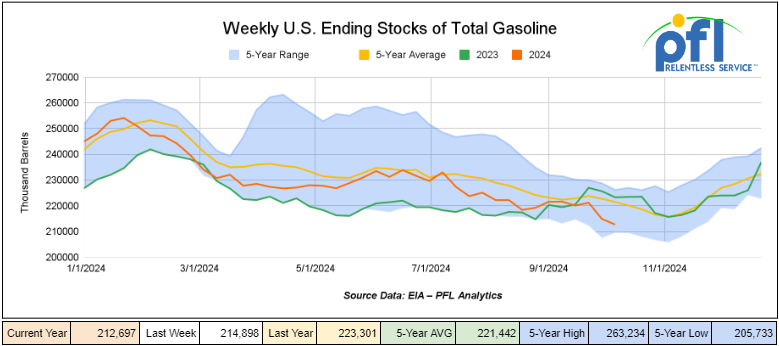
Total motor gasoline inventories decreased by 2.2 million barrels week-over-week and are 4% below the five-year average for this time of year. EIA’s estimate for overall gasoline demand fell sharply off, what many considered an overheated, hurricane-impacted number week over week with implied gasoline demand at 8.620 million barrels per day plunging 1.034 million b/d, or 10.7%, week over week. The bottom line is that everyone filled up in the east got their fill plus some. We are not worried about the larger-than-normal draw in this week’s numbers.
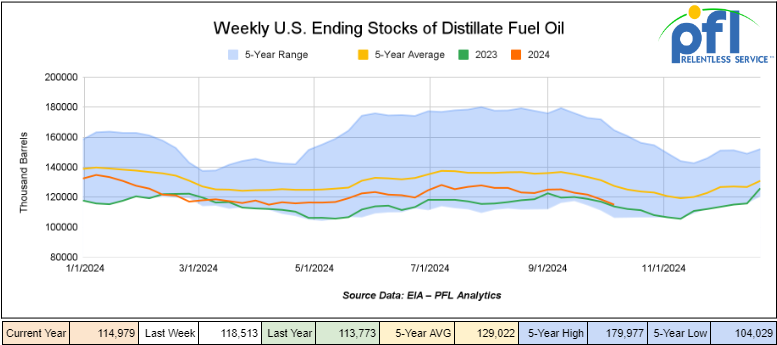
Distillate fuel inventories decreased by 3.5 million barrels week-over-week and are 10% below the five-year average for this time of year.
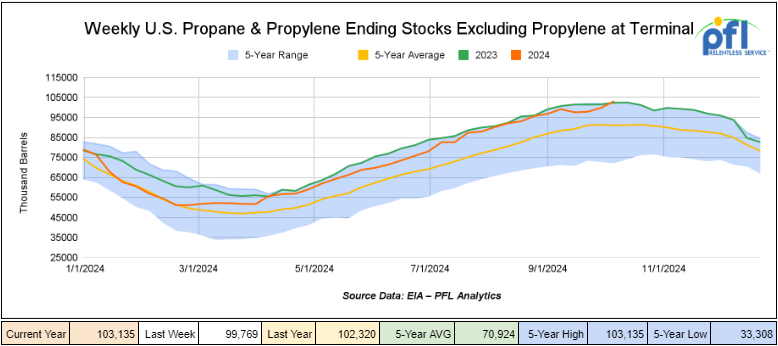
Propane/propylene inventories increased by 3.4 million barrels week-over-week and are 13% above the five-year average for this time of year.
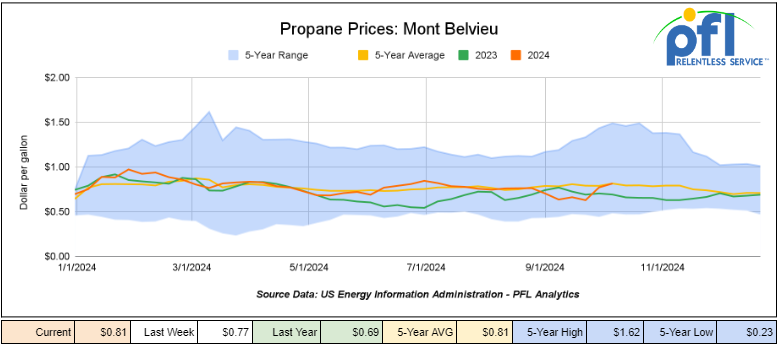
Propane prices closed at 81 cents per gallon on Friday of last week, up 4 cents per gallon week-over-week and up 12 cents per gallon year-over-year.
Overall, total commercial petroleum inventories decreased by 7 million barrels during the week ending October 11th, 2024.
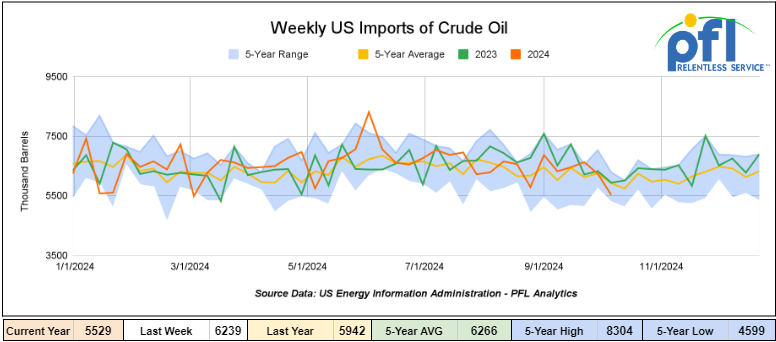
U.S. crude oil imports averaged 5.5 million barrels per day during the week ending October 11th, 2024, a decrease of 710,000 barrels per day week-over-week. Over the past four weeks, crude oil imports averaged 6.2 million barrels per day, 3.4% less than the same four-week period last year. Total motor gasoline imports (including both finished gasoline and gasoline blending components) averaged 526,000 barrels per day, and distillate fuel imports averaged 132,000 barrels per day during the week ending October 11th, 2024.
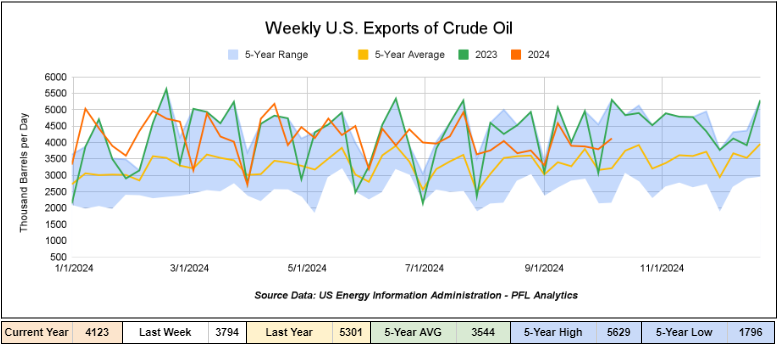
U.S. crude oil exports averaged 4.123 million barrels per day during the week ending October 12th, 2024, an increase of 329,000 barrels per day week-over-week. Over the past four weeks, crude oil exports averaged 3.923 million barrels per day.
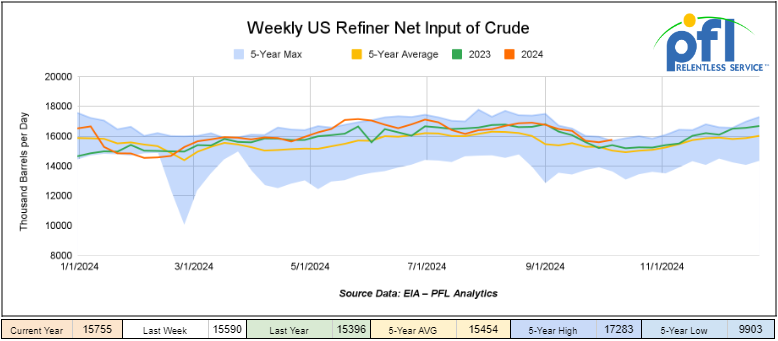
U.S. crude oil refinery inputs averaged 15.8 million barrels per day during the week ending October 11, 2024, which was 165,000 barrels per day more week-over-week.
WTI is poised to open at $70.34, up $1.12 per barrel from Friday’s close.
North American Rail Traffic
Week Ending October 16th, 2024.
Total North American weekly rail volumes were up (1.44%) in week 42, compared with the same week last year. Total carloads for the week ending on October 16th were 346,381, down (-2.04%) compared with the same week in 2023, while weekly intermodal volume was 351,126, up (5.13%) compared to the same week in 2023. 6 of the AAR’s 11 major traffic categories posted year-over-year decreases. The most significant decrease came from Motor Vehicles and Parts, which was down (-6.82%). The most significant increase came from Other which was up (+10.57%).
In the East, CSX’s total volumes were down (-3.35%), with the largest decrease coming from Grain (-17.28%) while the largest increase came from Forest Products (+12.23%). NS’s volumes were up (0.35%), with the largest increase coming from Grain (+37.83%), while the largest decrease came from Petroleum and Petroleum Products (-12.67%).
In the West, BN’s total volumes were up (+7.68%), with the largest increase coming from Intermodal (+13.3%) while the largest decrease came from Forest Products, down (-9.73%). UP’s total rail volumes were up (+3.3%) with the largest decrease coming from Coal, down (-17.68%), while the largest increase came from Other, which was up (+15.24%).
In Canada, CN’s total rail volumes were down (-7.55%) with the largest decrease coming from Coal, down (-26.52%) while the largest increase came from Other, up (+56.33%). CP’s total rail volumes were up (4.65%) with the largest increase coming from Nonmetallic Minerals (+21.77%), while the largest decrease came from Petroleum and Petroleum Parts (-23.06%). KCS’s total rail volumes were down (-6.75%) with the largest decrease coming from Petroleum and Petroleum Products (-31.65%) and the largest increase coming from Farm Products (+29.84%).
Source Data: AAR – PFL Analytics
Rig Count
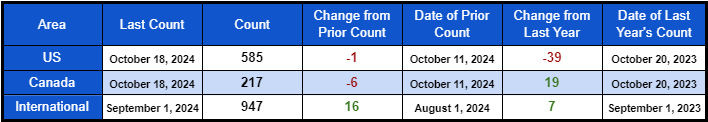
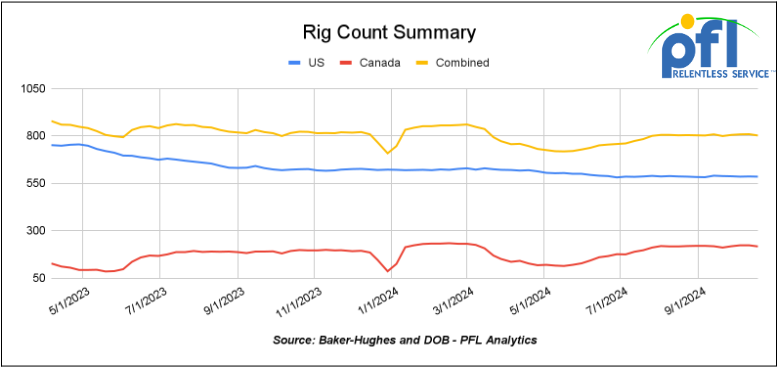
North American rig count was down by -7 rigs week-over-week. U.S. rig count was down by -1 rig week-over-week and down by -39 rigs year-over-year. The U.S. currently has 585 active rigs. Canada’s rig count was down -6 rigs week over week, but up by 19 rigs year-over-year and Canada’s overall rig count is 217 active rigs. Overall, year over year we are down by -20 rigs collectively.
North American Rig Count Summary
A few things we are watching:
We are watching industry conferences
Folks, PFL was a proud sponsor and had a table and attended in full force this fall’s Tank Car Committee Meeting in Dallas last week, which covered a wide range of topics focusing on enhancing the safety and reliability of tank cars used in rail transportation. Brian Baker, David Cohen, and Cyndi Popov were there to represent PFL.
The meeting addressed significant issues and set the stage for ongoing improvements in tank car safety and reliability.
Items of Interest:
- HM 127 Revision: HM 127 which deals with guidelines for the transportation of hazardous materials by rail, and hasn’t been revised since 2014, will have updated regulations and best practices by the end of the month. Implementation will take place over the next 3-5 years with immediate, short-term, and long-term phases.
- DOT-111 Tank Cars: Citing ongoing safety concerns, the AAR is recommending voluntary upgrades to DOT-117 tank cars for better accident survivability.
- Federal Railroad Administration (FRA) Audit: The FRA identified issues with tank car repair facilities, specifically the lack of approval from service equipment owners before repairs. There is a need for better coordination and compliance with FRA regulations.
Additional Items:
- Reviewed updates to Publication M-1002, including facility audits, welding qualifications, and non-destructive testing (NDT) procedures.
- Discussed improving the safety and reliability of tank cars, with specific points on fire performance, hinged and bolted manways, and the “stub sill 85% rule.”
- A new DOT 116 class for tank cars was proposed, aiming to enhance safety standards
- Addressed common causes of service disruptions and quality failures, particularly with hydrogen peroxide and multiple NARs (Notice of Release).
For more information on last week’s Tank Car Committee Meeting, call PFL today. The next conference PFL will be attending will be MARS in Chicago.
We are watching Petroleum Carloads
The four-week rolling average of petroleum carloads carried on the six largest North American railroads rose to 28,680 from 28,523, which was a gain of 157 rail cars week-over-week. Canadian volumes were higher. CPKC’s shipments rose by 10.3% week over week, CN’s volumes were higher by 1.2% week-over-week. U.S. shipments were mostly lower. The NS was the largest percentage decrease and was down 13.6%. The UP was a sole gainer and was up 4.3%.
We Are Watching Natural Gas
Natural gas prices have been struggling to rise above $3 per MMBtu in recent months due to several factors – warmer-than-expected weather across the U.S., lack of pipe, coupled with State and Federal regulations that punish the Natural Gas producer. For most of 2024, prices have hovered between $2.50-$3.00 per MMBtu, with natural gas closing at $2.258 per MMBtu on Friday of last week we are due to test new lows. Natural gas pricing is down by almost 1/3 year over year! (see below)
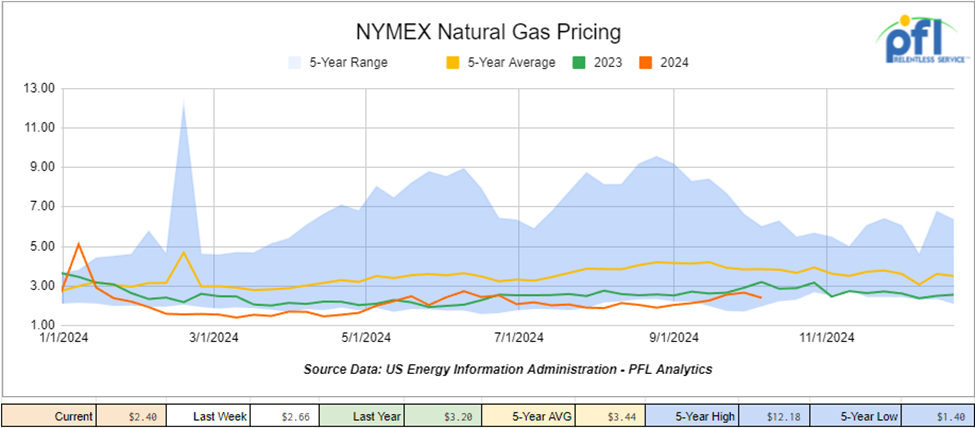
The warmer temperatures have dampened demand for heating, typically expected to pick up as the winter season approaches, resulting in lower demand for natural gas. This has been exacerbated by high storage levels, currently 163 Bcf above the five-year average, which continues to apply downward pressure on prices.
Natural gas prices are worse in Canada going negative for a few days!
The bearish market sentiment has been supported by consistent storage injections and forecasts that suggest continued mild weather in the coming weeks. Even though production has remained steady, there are weak consumption patterns, especially in the residential and commercial sectors that are keeping prices suppressed. As a result, natural gas prices are likely to remain under pressure in the short term, unless there is a significant uptick in demand driven by colder weather or other unexpected factors.
Liquified Natural Gas (LNG) prices face ongoing pressure as a new wave of export capacity is set to come online starting in 2026. The IEA projects global LNG production capacity will increase from the current 20,480 bcf per year to 30,000 bcf by 2030. However, demand may struggle to keep up with this oversupply, partly due to the growing shift toward renewable energy, which could drive natural gas prices significantly lower. The IEA also warns that if governments intensify their emission reduction efforts, some of the new LNG export projects may become unprofitable.
We need to burn more natural gas for clean power generation. The more natural gas that we burn, the more LPG’s we produce. Great for the environment, rail and the U.S. consumer.
We Are Watching Key Economic Indicators
Industrial Capacity and Utilization
In September 2024, U.S. industrial production saw a modest decline of 0.3%, following a 0.3% increase in August. This drop reflects ongoing fluctuations throughout the year. Manufacturing output, which makes up a significant portion of total production, also declined by 0.5% in September, after a slight rise in August. This marks continued volatility across key sectors, such as automotive production, which faced a 1.8% decline due to supply chain disruptions.
Capacity utilization, a measure of how fully firms are using their resources, decreased to 77.5%, down from 77.8% in August. The capacity utilization rate for manufacturing fell slightly to 76.7%, continuing its downward trend for the third consecutive month.

Lease Bids
- 100, 5200 Covered Hoppers needed off of UP or BN in Northwest for 6 months. Cars are needed for use in Pet Coke service. Roud Hatch, Bottom Outlet Doors
- 10, 5250 Covered Hoppers needed off of UP or BN in the Midwest for up to 5 years. Cars are needed for use in Dry Edible Beans service.
- 10, 2500CF Open Top Hoppers needed off of UP or BN in Texas for 5 years. Cars are needed for use in aggregate service. Need Rapid Discharge Doors
- 25, 3230 PD Hoppers needed off of NS or CSX in Ohio for 5 years. Cars are needed for use in Flyash service.
- 30, 4750-5200 Covered Hoppers needed off of BN or UP in Lake Charles, LA for 5 Years. Cars are needed for use in Pet Coke service.
- 50, 28.3K DOT 111 Tanks needed off of Any Class 1 in any location for 3-7 Years. Cars are needed for use in Base Oils service.
- 20, 25.5k CPC 1232 Tanks needed off of UP or BN in OK, TX for 3 Years. Cars are needed for use in Asphalt service.
- 10, 30K 117R or 117J Tanks needed off of Any Class 1 in USA for 1 year. Cars are needed for use in Glycerin service.
- 15-20, 29K 117R Tanks needed off of NS or CSX in Ohio for 6-12 Months. Cars are needed for use in Ply Oil service.
- 30-50, 23.5K Any Type Tanks needed off of any class 1 in any location for 1-5 years. Cars are needed for use in Glycols service.
- 50, 23.5-25.5 DOT111 Tanks needed off of Any Class 1 in USA for 5 years. Cars are needed for use in Asphalt service.
Sales Bids
- 100-150, 3400CF Covered Hoppers needed off of UP BN in Texas. Cars are needed for use in Cement service. Cement Gates needed.
- 20, 17K DOT111 Tanks needed off of various class 1s in various locations. Cars are needed for use in corn syrup service.
- 4, 25.5K DOT 111 Tanks needed off of any class 1 in Texas.
- 10, 30K DOT 111 Tanks needed off of any class 1 in Texas. Cars are needed for use in UCO service.
- 10, 5600CF PD Hoppers needed off of any class 1 in Texas.
- 50, 4750CF Covered Hoppers needed off of any class 1 in Texas. Cars are needed for use in Grain service.
Lease Offers
- 50, 5400, Covered Hoppers located off of NS, IORY in MI. Cars were last used in bean meal. 1 year+
- 90, 25.5K, DOT 111 Tanks located off of UP in Texas. Cars were last used in Fuel OIl. 2-3 Year Term
- 50, 28.3K, 117R Tanks located off of All Class 1s in St. Louis. Cars are clean 1 Year Term
Sales Offers
- 100-300, 3400, Covered Hoppers located off of various class 1s in multiple locations. Sand Cars
- 150, 28.3K, DOT117J Tanks located off of various class 1s in multiple locations. Will take 90K
- 300, 31.8K, CPC 1232 Tanks located off of BN in Texas.
- 40, 33K, 340W Pressure Tanks located off of Multiple in All over.
Call PFL today to discuss your needs and our availability and market reach. Whether you are looking to lease cars, lease out cars, buy cars, or sell cars call PFL today at 239-390-2885
Live Railcar Markets
| CAT | Type | Capacity | GRL | QTY | LOC | Class | Prev. Use | Offer | Note |
|---|
PFL will be at the Following Conferences

- Where: Loews Arlington Hotel
- Attending: Brian Baker (239.297.4519), David Cohen (954-729-4774), and Curtis Chandler (239-405-3365)
- Conference Website

- Where: The Westin Galleria Dallas
- Attending: David Cohen (954-729-4774), and Curtis Chandler (239-405-3365)
- Conference Website

- Where: The Westin Galleria Dallas
- Attending: Brian Baker (239.297.4519)
- Conference Website