The post PFL Railcar Report 3-2-2026 appeared first on PFL Petroleum Services LTD.
]]>Jobs Update
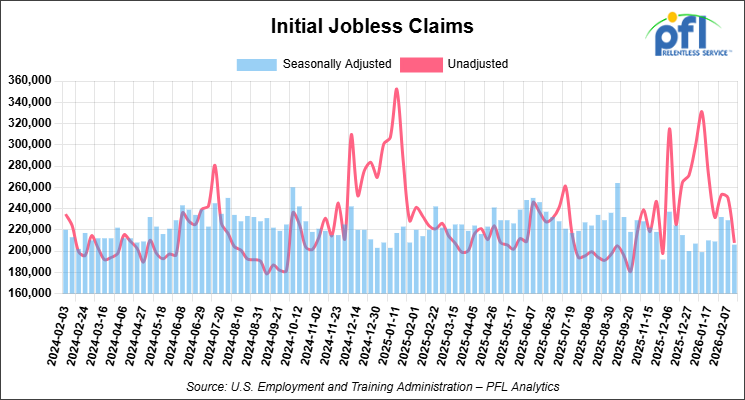
- Initial jobless claims seasonally adjusted for the week ending February 21, 2026 came in at 212,000, versus the adjusted number of 208,000 people from the week prior, up 4,000 people week over week.
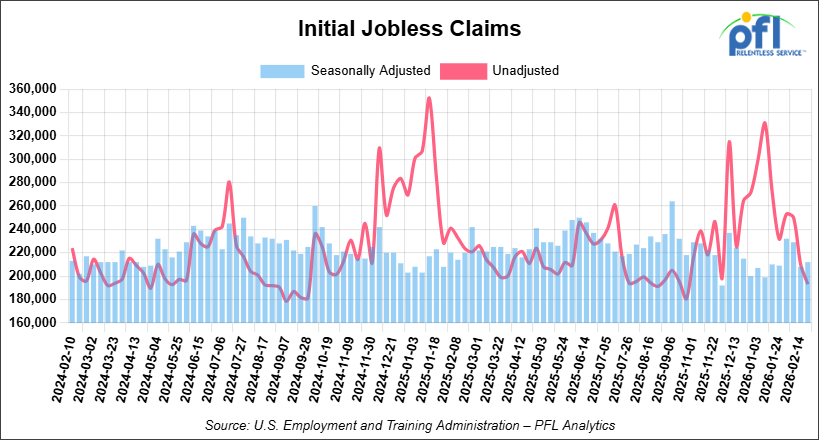
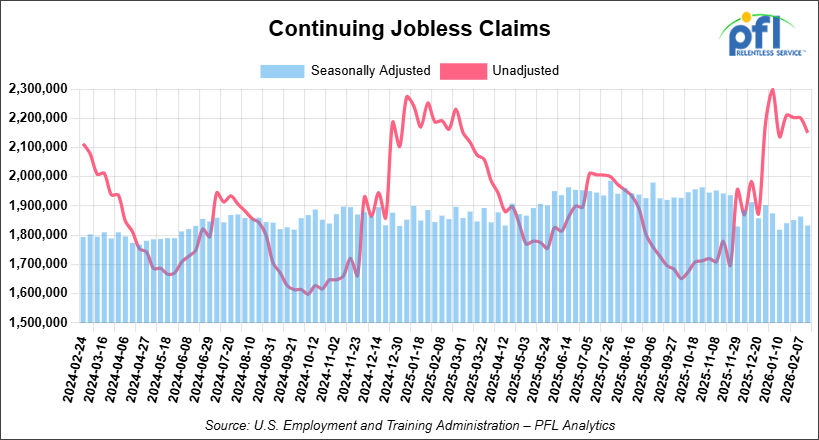
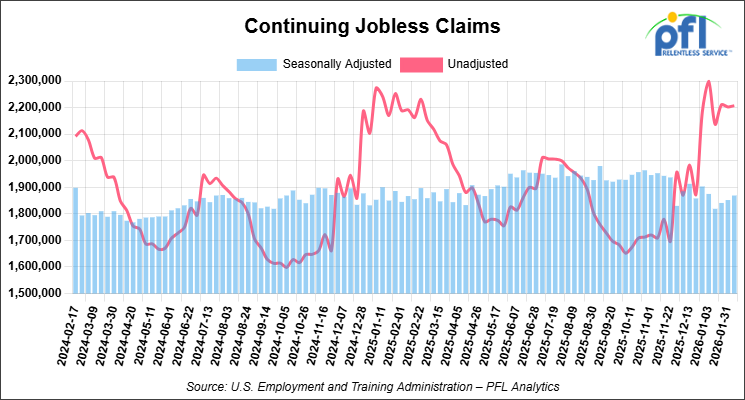
- Continuing jobless claims came in at 1,833,000, versus the adjusted number of 1,864,000 people from the week prior, down 31,000 week-over-week.
Stocks closed lower on Friday of last week and lower week-over-week
The DOW closed lower on Friday of last week, down -521.28 points (-1.05%), closing out the week at 48,997.92, down -628.05 points week-over-week. The S&P 500 closed lower on Friday of last week, down -29.98 points (-0.43%), and closed out the week at 6,878.88, down -30.63 points week-over-week. The NASDAQ closed lower on Friday of last week, down -210.17 points (-0.92%), and closed out the week at 22,668.21, down -217.86 points week-over-week.
In overnight trading, DOW futures traded lower and are expected to open at 48,487 this morning, down 503 points from Friday’s close.
Crude oil closed higher on Friday of last week and higher week-over-week
West Texas Intermediate (WTI) crude closed up $1.81 per barrel (2.78%), to close at $67.02 on Friday of last week, and up $0.63 week-over-week. Brent crude closed up $1.73 per barrel (2.45%), to close at $72.48, and up $0.72 week-over-week.
One Exchange WCS (Western Canadian Select) for April delivery settled on Friday of last week at US$13.95 below the WTI-CMA (West Texas Intermediate – Calendar Month Average). The implied value was US$53.07 per barrel.
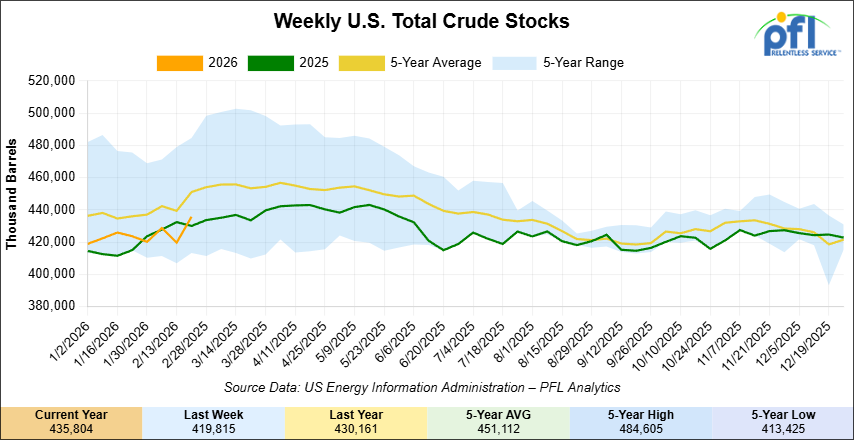
U.S. commercial crude oil inventories (excluding those in the Strategic Petroleum Reserve) increased by 16 million barrels week-over-week. At 435.8 million barrels, U.S. crude oil inventories are 3% below the five-year average for this time of year.
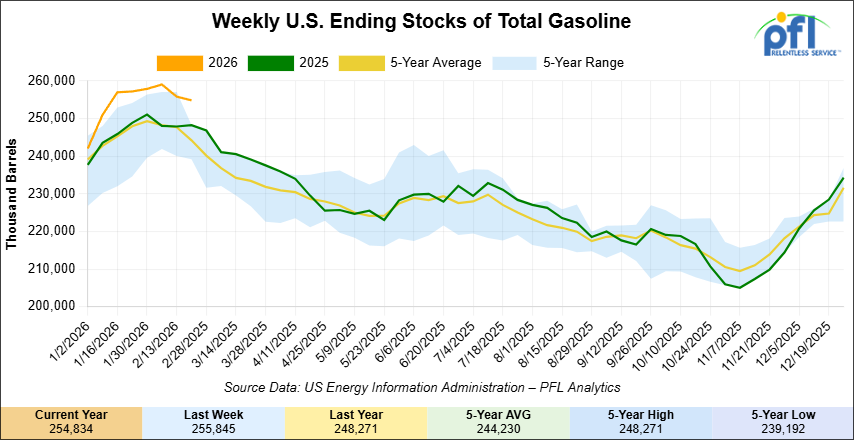
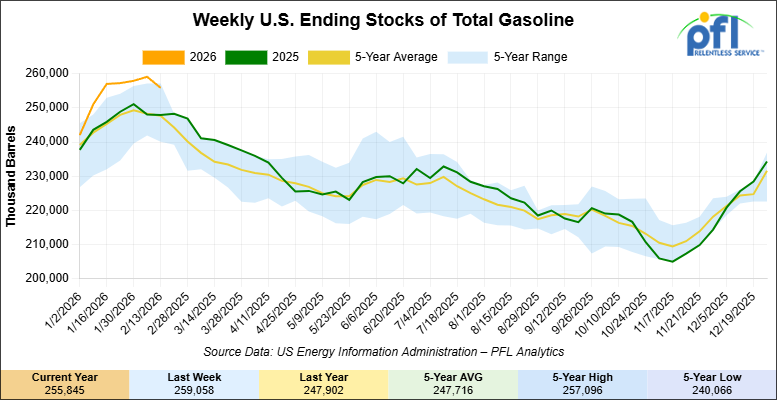
Total motor gasoline inventories decreased by 1 million barrels week-over-week and are 3% above the five-year average for this time of year.
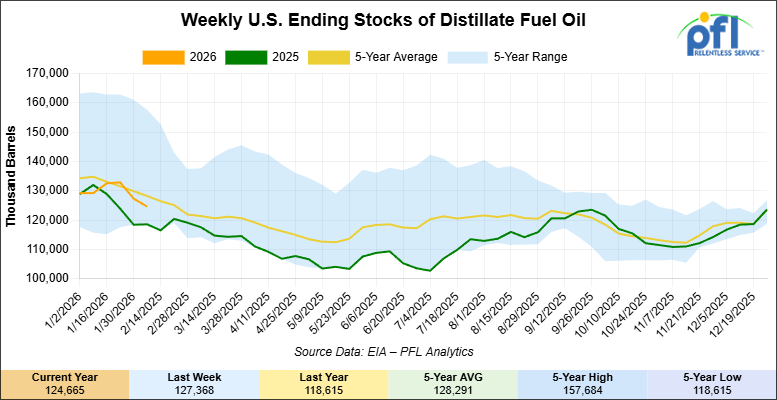
Distillate fuel inventories increased by 300,000 barrels week-over-week and are 5% below the five-year average for this time of year.
Propane/propylene inventories decreased by 1.7 million barrels week-over-week and are 46% above the five-year average for this time of year
Propane prices closed at 60.5 cents per gallon on Friday of last week, down 0.4 cents per gallon week-over-week, and down 29.7 cents year-over-year.
Overall, total commercial petroleum inventories increased by 11.2 million barrels week-over-week, during the week ending February 20, 2026.
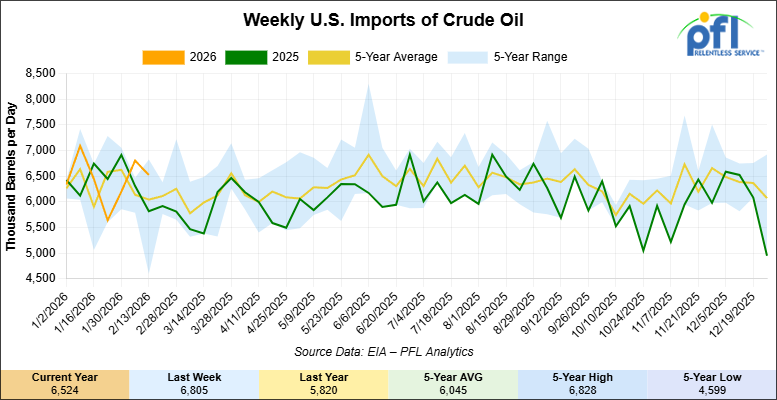
U.S. crude oil imports averaged 6.7 million barrels per day last week, an increase of 136,000 barrels per day week-over-week. Over the past four weeks, crude oil imports averaged 6.5 million barrels per day, 4.9% more than the same four-week period last year. Total motor gasoline imports (including both finished gasoline and gasoline blending components) averaged 563,000 barrels per day, and distillate fuel imports averaged 411,000 barrels per day during the week ending February 13, 2026.
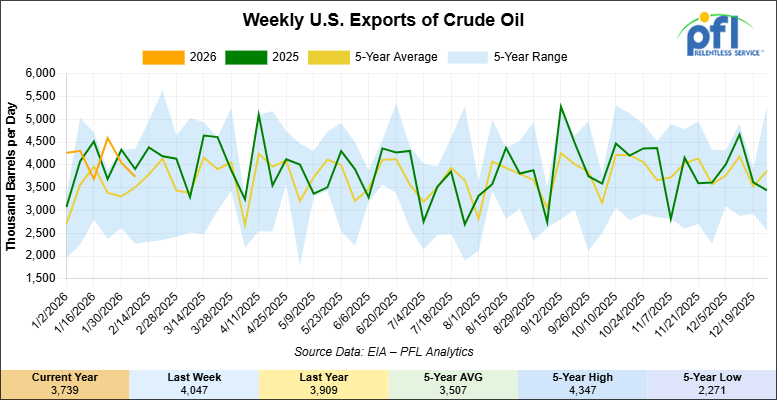
U.S. crude oil exports averaged 4.313 million barrels per day during the week ending February 20, 2026, a decrease of 277,000 barrels per day week-over-week. Over the past four weeks, crude oil exports averaged 4.172 million barrels per day.

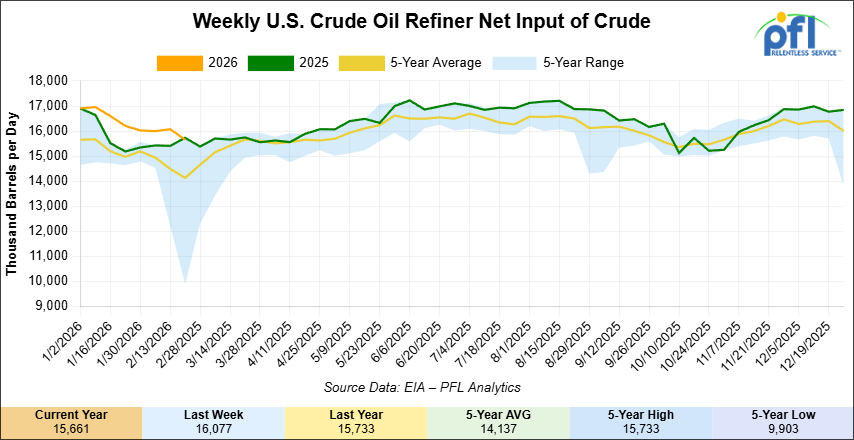
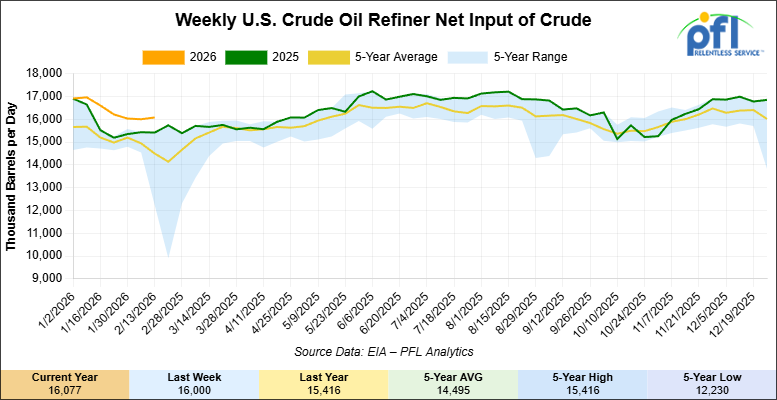
U.S. crude oil refinery inputs averaged 15.7 million barrels per day during the week ending February 20, 2026, which was 416,000 barrels per day less week-over-week.
WTI is poised to open at $71.88, up $4.86 per barrel from Friday’s close.
North American Rail Traffic
Week Ending February 25, 2025:
Total North American weekly rail volumes were up (+7.88%) in week 9, compared with the same week last year. Total Carloads for the week ending February 25, 2025 were 329,929, up (+13.32%) compared with the same week in 2025, while weekly Intermodal volume was 339,155, up (+3.07%) year over year. 10 of the AAR’s 11 major traffic categories posted year-over-year increases. The largest decrease came from Forest Products (-15.82%). The largest increase was Grain (+43.90%).
In the East, CSX’s total volumes were up (+11.86%), with the largest decrease coming from Forest Products (-5.80%), while the largest increase came from Grain (+44.65%). NS’s total volumes were up (+6.28%), with the largest increase coming from Coal (+44.67%), while the largest decrease came from Other (-4.88%).
In the West, BNSF’s total volumes were up (+12.76%), with the largest increase coming from Grain (+76.15%), while the largest decrease came from Chemicals (-3.01%). UP’s total volumes were up (+5.48%), with the largest increase coming from Grain (+43.54%), while the largest decrease came from Intermodal Units (-3.18%).
In Canada, CN’s total volumes were up (+18.18%), with the largest increase coming from Grain (+80.56%), while the largest decrease came from Forest Products (-6.11%). CPKCS’s total volumes were down (-20.51%), with the largest increase coming from Nonmetallic Minerals (+36.19%), while the largest decrease came from Forest Products (-68.06%).
Source Data: AAR – PFL Analytics
North American Rig Count Summary
Rig Count
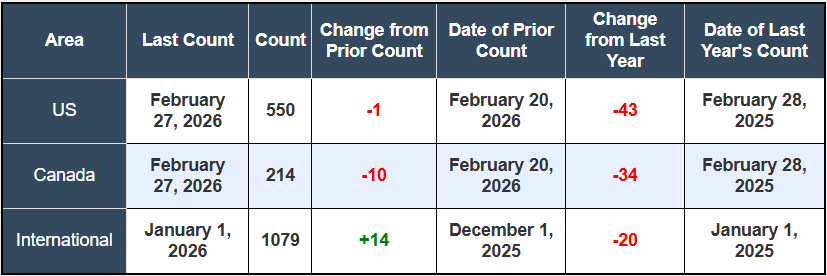
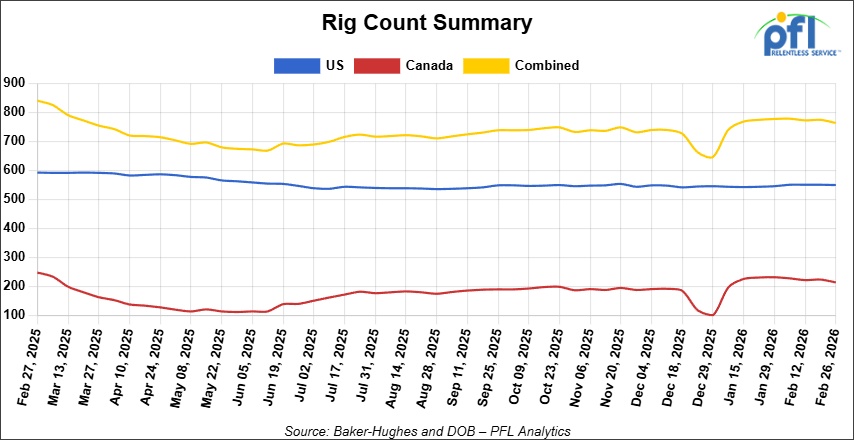
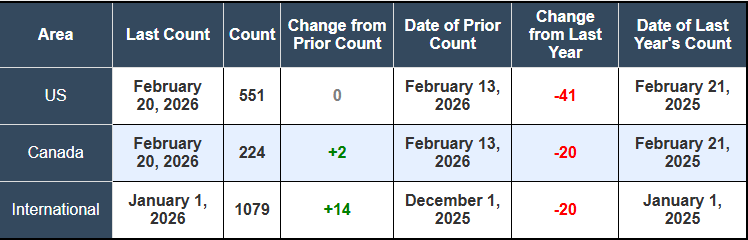
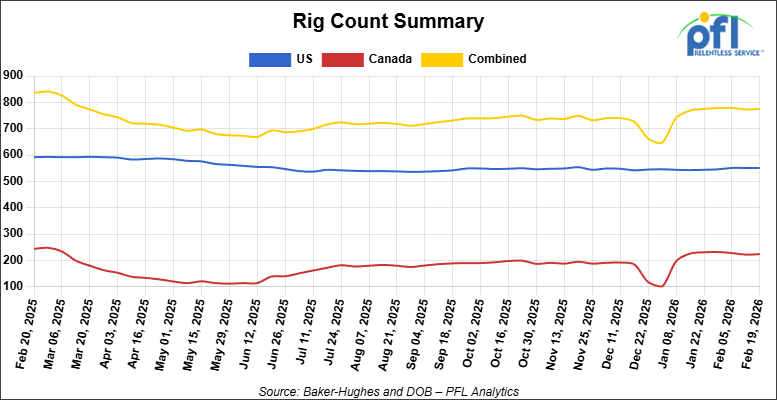
North American rig count was down by -11 rigs week-over-week. The U.S. rig count was down by -1 rig week-over-week, and down by -43 rigs year-over-year. The U.S. currently has 550 active rigs. Canada’s rig count was down by -10 rigs week-over-week and down by -34 rigs year-over-year. Canada currently has 214 active rigs. Overall, year-over-year we are down by -77 rigs collectively.
We are watching a few things out there for you:
We are Watching Petroleum Carloads
The four-week rolling average of petroleum carloads carried on the six largest North American railroads rose to 29,874 from 29,673 which was an increase of +201 rail cars week-over-week. Canadian volumes fell. CN’s shipments were lower by -2.0% week-over-week, CPKC’s volumes were lower by -11.0% week-over-week. U.S. shipments were mixed. The UP had the largest percentage increase and was up by +4.0%. The BN had the largest percentage decrease and was down by -5.0%.
We are Watching the Middle East
Early Saturday morning, the United States and Israel launched what President Trump called “major combat operations” against Iran, under the name Operation Epic Fury. Strikes have been reported across multiple Iranian cities including Tehran, Isfahan, Qom, Tabriz, and Bushehr, targeting military infrastructure, nuclear facilities, and senior leadership. Iran responded quickly, launching ballistic missiles and drones against U.S. military bases in Bahrain, Qatar, and the UAE. The UN Security Council convened an emergency session Saturday. As of this writing, the conflict is live and its scope and duration remain unknown. New leadership has emerged in Iran and vows to strike back, shutting down an oil refinery in Saudi Arabia and civilian targets across gulf state countries.
The crude market was moving before the bombs fell. Three rounds of nuclear talks in Geneva broke down last week over Iran’s refusal to remove its enriched uranium stockpile from the country. WTI settled Friday at $67.02/bbl, its highest close since August, while Brent closed at $72.87/bbl. Both benchmarks had already gained 6-8% over the prior two weeks as U.S. military assets concentrated in the region. Oil is already up 5% in premarket trading. Worth noting: a 16 million barrel build in U.S. commercial crude inventories last week would normally be a bearish fundamental that geopolitics is currently steamrolling
Roughly one-quarter of the world’s seaborne oil trade passes through the Strait of Hormuz daily. Iran has the capability to create serious disruption through tanker harassment, mining, and anti-ship missiles even without a full closure. UBS has publicly flagged a spike to $100/bbl as plausible in a sustained escalation scenario. Some Gulf producers, notably Abu Dhabi, are already ramping crude exports to cushion supply concerns, though that covers a fraction of the exposure.
For our readers, this changes the framework immediately. Prior to Saturday, the narrative was oversupplied markets, soft WCS differentials, and marginal CBR economics. A sustained WTI move above $70-75/bbl reshapes that calculus fast. Higher flat price improves crude-by-rail margins, and any tightening of global heavy sour supply improves the competitive position of Canadian WCS with U.S. Gulf Coast refiners. The Monday morning NYMEX open is the first real read on how the market is pricing this.
We are Watching Canadian Crude Oil Exports by Rail
The Canadian Energy regulator reported on February 24, 2026, that 81,189 barrels were exported during the month of December 2025 down from 85,055 barrels in November of 2025, a decrease of 3,866 barrels per day month-over-month.
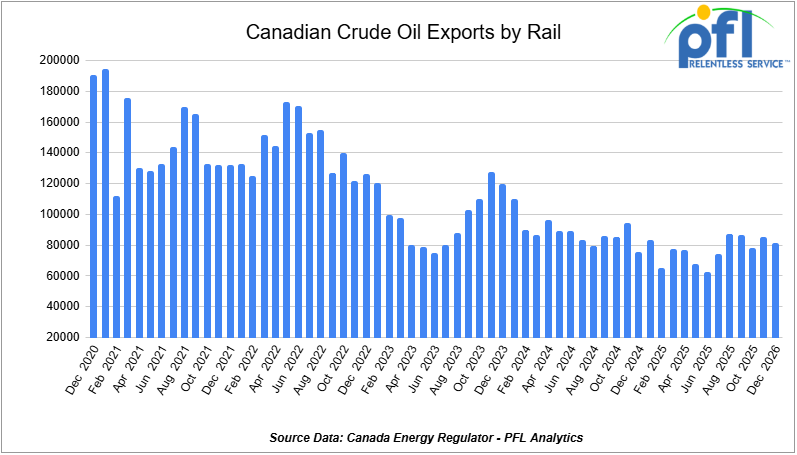
Crude by rail will always be necessary out of Canada for stranded oil not connected by pipelines. Raw bitumen, which is shipped as a non-haz product and is not able to flow in pipelines, is competitive with pipeline tolls and is a growing market to keep an eye on, particularly in light of Strathcona and Gibson announcing new projects. Other factors would be existing long-term contractual commitments and basis – we really need to see the basis WTI-CMA (West Texas Intermediate – Calendar Month Average) blowout to -18 per barrel for sustained periods of time to make economic sense. Current rail rates from Alberta to the U.S. Gulf Coast have averaged $15.36 per barrel, making rail competitive whenever WCS-WTI spreads exceed $18 per barrel, including quality adjustments.
We are Watching Canadian Crude Economics
An important dynamic surfaced on Par Pacific’s fourth quarter earnings call last week. The company’s CEO described Par Pacific as an “indirect beneficiary” of Venezuelan crude returning to the Gulf Coast market. More Venezuelan heavy sour barrels at the Gulf Coast push Canadian barrels back into the midcontinent, where Par Pacific can process 40,000 to 50,000 b/d of Western Canadian Select across its Rocky Mountains and Washington refineries. The company quantified it directly: for every $1/bbl improvement in WCS differentials, Par Pacific estimates a $15-16 million annual benefit.
The Iran situation changes this math immediately if WTI moves higher, as the rail rate is largely fixed while WCS differentials and WTI flat price can reprice overnight.
Pembina Pipeline sanctioned its Taylor-to-Gordondale condensate expansion last week at C$115 million, targeting a Q1 2027 in-service date. Its Birch-to-Taylor expansion adds another C$310 million for 120,000 b/d of propane-plus and condensate capacity in northeast BC, coming online Q4 2027. The condensate story and the crude egress story are two sides of the same coin: Alberta production is growing, and the infrastructure supporting it is still playing catch-up.
We are Still Watching Line 5
Folks, we have been watching this one forever. The Governor of Michigan Gretchen Whitmer still wants this pipeline shut down for whatever reason and the battle continues. On Tuesday, the U.S. Supreme Court heard oral arguments in Enbridge Energy LP v. Nessel, the years-long battle over whether Michigan Attorney General Dana Nessel’s lawsuit to decommission Line 5 should be heard in state or federal court. The pipeline carries 540,000 barrels per day of light crude and natural gas liquids through the Straits of Mackinac, serving refineries in Michigan, Ohio, Pennsylvania, Ontario, and Quebec.
The question before the court is technically narrow but strategically enormous. Enbridge missed the mandatory 30-day deadline to remove Nessel’s 2019 state court lawsuit to federal court by over two years. Enbridge argues the deadline should be flexible given the international treaty implications of a cross-border pipeline. Michigan’s solicitor general called that position an “atextual escape hatch.” The distinction matters because a federal court has already ruled in a separate proceeding that federal pipeline safety law pre-empts Michigan’s authority to order a shutdown, while a state court applying Michigan’s public trust doctrine would be far more sympathetic to Nessel’s closure case. A ruling is expected before June.
If Line 5 is ultimately forced into prolonged uncertainty or shutdown proceedings, crude-by-rail out of Alberta becomes materially more attractive overnight (problem is there is not enough rail cars to even put a dent in that type of volume). Loss of that 540,000 b/d artery forces barrels onto the rail network. Enbridge’s proposed tunnel replacement has Army Corps permitting expected in coming weeks and faces a Michigan Supreme Court challenge scheduled for March 11th. This situation has multiple fronts and none of them are near resolution.
We are Watching a New Pipeline Proposal
Privately held Bridger Pipeline has filed applications with Montana regulators and the U.S. Bureau of Land Management for a 645-mile, 550,000 b/d pipeline running from the U.S.-Canada border in Phillips County, Montana to Guernsey, Wyoming. The details should look familiar: the border entry point is the same one designated for the cancelled Keystone XL line, it uses the same 36-inch pipe diameter, and Bridger says it would leverage existing infrastructure on the Canadian side. Construction could begin as early as July 2027, with an in-service target of mid-2030, assuming a presidential permit clears.
Keystone XL owner South Bow says it is evaluating an expansion that could link Canadian volumes to the Bridger line at Guernsey, though it offered no details ahead of its March 6 quarterly results. From Guernsey, multiple routing options reach downstream markets including a looped Pony Express pipeline to Cushing, or a revival of the shelved Liberty Pipeline route where Bridger and Tallgrass still hold right-of-way. Tallgrass is simultaneously running an open season for Bakken-to-Cushing capacity on the Pony Express, which typically runs near capacity.
The urgency is real. South Bow projects that Western Canadian Sedimentary Basin production will exceed pipeline takeaway capacity by mid-2027. Enbridge is planning a two-phase Mainline expansion adding 400,000 b/d. Trans Mountain is weighing 90,000 b/d of additional capacity through drag reducing agents by January 2027 with a further 210,000 b/d expansion possible by 2029-30. Until any of these pipes are in the ground, crude-by-rail remains the pressure valve for Alberta producers running into the capacity wall.
We are Watching Rail Terminal Consolidation
Canadian rail terminal operator Cando Rail & Terminal announced last week it is acquiring the rail terminal assets of U.S. based Savage Enterprises for an undisclosed sum. The combined company creates a coast-to-coast network of 36 railcar terminals, three short-line railways, and 80 first-and-last-mile operations with connections to all six Class I railroads. This is Cando’s fourth acquisition in two years, bringing its total investment to approximately $1 billion. Closing is expected in the second quarter subject to regulatory approval.
Savage brings a substantial Houston Ship Channel energy footprint, handling hundreds of thousands of railcars of chemical and petrochemical products annually, including petroleum liquids, petroleum coke, sulfur, and polymers. It also has Bakken exposure through a two-mile crude pipeline connecting its Trenton, North Dakota terminal to Energy Transfer’s 750,000 b/d Dakota Access system. Combined with Cando’s October acquisition of the Channelview terminal, which can stage and transload 900 railcars with Class I connections to BNSF, CPKC, and UP, the combined entity becomes a significant player in North American energy logistics. The scale of this consolidation reflects the ongoing view that terminal infrastructure is a durable long-term asset in the rail sector.
We are Watching the Canola Rush
March 1st arrived, and China delivered on half the deal. Beijing’s Finance Ministry issued a formal statement on Friday of last week confirming the suspension of 100% tariffs on Canadian canola meal, peas, lobster, and crab, effective today through year-end 2026. What was conspicuously absent from that statement: any mention of canola seed. The $4 billion seed market, and the headline commitment from Carney’s January Beijing visit to cut seed tariffs from 84% to 15%, went unconfirmed by Chinese authorities as of press time. Ottawa’s response was measured: a statement from the Minister of International Trade’s office said the seed tariff reduction is “on track as officials work on implementation details” and that “more information will be available in due course.” That is not the same as confirmation from Beijing.
The rail market had already been pricing in the full deal. According to the Globe and Mail, canola shipments in the final two weeks of February surged far above 2025 levels as exporters pushed product toward Vancouver ahead of the deadline. The Canadian Grain Commission’s weekly data showed the surge was real, with grain carloads for the week of February 21 hitting 24,463, up 8,121 week-over-week according to the AAR data. Those shipments are now crossing the Pacific, a 20-21 day voyage from Vancouver, and will arrive in Chinese ports expecting a 15% tariff. If Beijing doesn’t formally confirm the seed reduction in the coming days, there is going to be a very uncomfortable conversation at the dock.
The canola meal confirmation is genuinely meaningful, China was importing nearly 2 million metric tonnes annually before the 2025 tariff surprise gutted the trade, and restoring that flow is a real covered hopper tailwind on CN and CPKC corridors heading west. But the seed story is the one to watch. Six million tonnes annually and $4 billion in trade doesn’t come back until Beijing puts it in writing. We will be updating readers as this develops.
We are Watching a Rail Safety Bill Reintroduced
Three years after the Norfolk Southern derailment in East Palestine, Ohio, a bipartisan group of eight U.S. senators led by Sen. Maria Cantwell (D-WA) reintroduced the Bipartisan Railway Safety Act of 2026 on February 24. The original bill stalled in Congress in 2023-24 due to industry opposition and Republican resistance.
The bill mandates expanded deployment of wayside hotbox detectors, the temperature sensors that flagged the NS East Palestine train’s overheating bearings but under existing railroad policy did not compel a stop in time. It requires all railcars to undergo a full inspection at least once every five years, expands the hazardous chemicals list to include vinyl chloride, and mandates speed restrictions, improved braking technology, and route risk analysis for hazmat movements. The maximum civil penalty for safety violations would jump from $100,000 to $10 million per violation. Carriers would also face new requirements to notify states about hazardous materials crossing their borders.
The legislation has union support. The Association of American Railroads has historically pushed back on prescriptive mandates, and passage in a Republican-controlled Senate is far from certain. Regardless of this bill’s fate, the trajectory toward greater compliance obligations and increased hazmat scrutiny is a durable trend. Operators moving crude, ethanol, and LPG by rail should track this closely.
We are Watching Key Economic Indicators
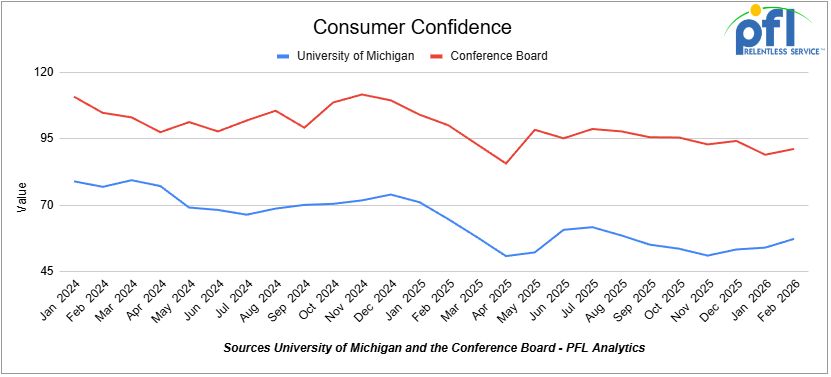
Consumer Confidence
The Index of Consumer Sentiment from the University of Michigan increased from 54.0 in January to 57.3 in February.
The Conference Board Consumer Confidence Index increased from 89.0 in January to 91.2 in February.
Lease Bids
- 100, 21.9K 117J Tanks located off of All Class 1s in Midwest. For use in CO2 service. Period: 6 months.
- 30-50, 30K 117J Tanks located off of NS or CSX in Northeast. For use in C5 service. Period: 1 year.
- 20-50, 4000-5000 Covered Hoppers located off of UP or BN in Houston. For use in Urea, Potash, Ammonium Sulfate service. Period: 6-12 Months.
- 200, 33K Pressure Tanks located off of CSX or NS in Ohio. For use in Propylene service. Period: 18 Months.
- 30-50, 25.5K Dot 111 Tanks located off of All Class 1s in Anywhere. For use in Asphalt service. Period: 1-3 Years.
Sales Bids
- 28, 3400CF Covered Hoppers located off of UP BN in Texas. For use in Cement service. Cement Gates needed.
- 20, 17K DOT111 Tanks located off of various class 1s in various locations. For use in corn syrup service.
- 120, Various Open-Top Aluminum Rotary Gondolas located off of various class 1s in various locations. For use in Sulphur service. Built 2004 or later.
- 30, 29K DOT111 Tanks located off of various class 1s in Chicago. For use in Veg Oil service.
Lease Offers
- 100, 30K CPC1232 Tanks located off of UP or BN in Texas. Last used in Diesel.
- 100, 30K DOT117R Tanks located off of UP or BN in Texas. Last used in Gasoline.
- 100, 29K DOT117R Tanks located off of UP or BN in Texas. Last used in Gasoline. Coiled and Insulated.
- 21, 6351 Covered Hoppers located off of CN in Wisconsin. Last used in DDG. Available until February 2027.
- 29, 6500 Covered Hoppers located off of CN in Wisconsin. Last used in DDG. Available until February 2027.
- 50, 20K DOT117J Tanks located off of All Class 1s in Moving. Last used in Styrene.
- 29, 25.5K DOT117J Tanks located off of UP or BN in Texas. Cars are currently clean. Cars are currently clean.
- 90, 30K DOT117J Tanks located off of UP or BN in Corpus Christie. Last used in Diesel.
- 200, 340W DOT 112J Tanks located off of All Class 1s in Multiple Locations. Last used in Propane and Butane. Cars are currently clean.
- 15, 6200CF Covered Hoppers located off of All Class 1s in Wisconsin. Last used in Plastic. Cars are currently clean.
- 30, 6500CF Covered Hoppers located off of All Class 1s in Wisconsin. Last used in Plastic. Cars are currently clean.
- 50, 30K DOT117J Tanks located off of UP or BN in Corpus Christie. Last used in Gasoline.
- 24, 21K Stainless Steel Tanks located off of UP in Texas / Mexico Border. Last used in SULFACTANT. Cars are currently clean.
- 34, 30K DOT 111 Tanks located off of UP in Texas / Mexico Border. Last used in Veg Oil. Cars are currently clean.
Sales Offers
- 50, 31.8K CPC1232 Tanks located off of UP or BN in TX. Last used in Multiple. Requal Due in 2025.
- 35, 3400CF Covered Hoppers located off of UP or BN in Midwest. Last used in Sand.
- 25, 30K 117J Tanks located off of CSX in Jackson, TN. Last used in Fuels. Newly Requalified.
Call PFL today to discuss your needs and our availability and market reach. Whether you are looking to lease cars, lease out cars, buy cars, or sell cars call PFL today at 239-390-2885
Live Railcar Markets
| CAT | Type | Capacity | GRL | QTY | LOC | Class | Prev. Use | Offer | Note |
|---|
PFL will be at the Following Conferences

- Where: La Quinta, CA
- Attending: David Cohen (954-729-4774)
- Conference Website

- Where: Hyatt Regency Dallas in Dallas, TX
- Attending:Curtis Chandler (239.405.3365), David Cohen (954-729-4774), Brian Baker (239.297.4519), Cyndi Popov(403) 402-5043
- Conference Website
The post PFL Railcar Report 3-2-2026 appeared first on PFL Petroleum Services LTD.
]]>The post PFL Railcar Report 2-23-2026 appeared first on PFL Petroleum Services LTD.
]]>Abraham Lincoln
Jobs Update
- Initial jobless claims seasonally adjusted for the week ending February 14, 2026 came in at 206,000, versus the adjusted number of 229,000 people from the week prior, down 23,000 people week over week.
- Continuing jobless claims came in at 1,869,000, versus the adjusted number of 1,852,000 people from the week prior, up 17,000 week-over-week.
Stocks closed higher on Friday of last week and higher week-over-week
The DOW closed higher on Friday of last week, up 230.81 points (0.47%), closing out the week at 49,625.97, up 125.04 points week-over-week. The S&P 500 closed higher on Friday of last week, up 47.62 points (0.69%), and closed out the week at 6,909.51, up 73.34 points week-over-week. The NASDAQ closed higher on Friday of last week, up 203.34 points (0.90%), and closed out the week at 22,886.07, up 339.40 points week-over-week.
In overnight trading, DOW futures traded lower and are expected to open at 49,550 this morning, down -124 points from Friday’s close.
Crude oil closed mixed on Friday of last week and higher week-over-week
West Texas Intermediate (WTI) crude closed down -0.04 per barrel (-0.06%), to close at $66.39 on Friday of last week, but up $3.50 week-over-week. Brent crude closed up 0.10 per barrel (0.14%), to close at $71.76, and up $4.01 week-over-week.
One Exchange WCS (Western Canadian Select) for April delivery settled on Friday of last week at US$15.00 below the WTI-CMA (West Texas Intermediate – Calendar Month Average). The implied value was US$51 per barrel.
U.S. commercial crude oil inventories (excluding those in the Strategic Petroleum Reserve) decreased by 9 million barrels week-over-week. At 419.8 million barrels, U.S. crude oil inventories are 5% below the five-year average for this time of year.

Total motor gasoline inventories decreased by 3.2 million barrels week-over-week and are 3% above the five-year average for this time of year.
Distillate fuel inventories decreased by 4.6 million barrels week-over-week and are 5% below the five-year average for this time of year.

Propane/propylene inventories decreased 3.1 million barrels week-over-week and are 39% above the five-year average for this time of year.

Propane prices closed at 60.9 cents per gallon on Friday of last week, down 1.7 cents per gallon week-over-week, and down 32 cents year-over-year.

Overall, total commercial petroleum inventories decreased by 19.1 million barrels week-over-week, during the week ending February 13, 2026.
U.S. crude oil imports averaged 6.5 million barrels per day last week, a decrease of 281,000 barrels per day week-over-week. Over the past four weeks, crude oil imports averaged 6.3 million barrels per day, 1.3% less than the same four-week period last year. Total motor gasoline imports (including both finished gasoline and gasoline blending components) averaged 353,000 barrels per day, and distillate fuel imports averaged 199,000 barrels per day during the week ending February 13, 2026.
U.S. crude oil exports averaged 4.59 million barrels per day during the week ending February 13, 2026, an increase of 851,000 barrels per day week-over-week. Over the past four weeks, crude oil exports averaged 4.241 million barrels per day.

U.S. crude oil refinery inputs averaged 16.1 million barrels per day during the week ending February 13, 2026, which was 77,000 barrels per day more week-over-week.
WTI is poised to open at $66.07, down 41 cents per barrel from Friday’s close.
North American Rail Traffic
Week Ending February 18, 2026:
Total North American weekly rail volumes were up (+3.77%) in week 8, compared with the same week last year. Total Carloads for the week ending February 18, 2026 were 330,593, up (+5.51%) compared with the same week in 2025, while weekly Intermodal volume was 343,782, up (+2.16%) year over year. 10 of the AAR’s 11 major traffic categories posted year-over-year increases. The largest decrease came from Forest Products (-17.37%). The largest increase was Grain (+39.72%).
In the East, CSX’s total volumes were up (+0.23%), with the largest decrease coming from Coal (-18.61%), while the largest increase came from Intermodal Units (+9.42%). NS’s total volumes were up (+1.43%), with the largest increase coming from Petroleum & Petroleum Products (+16.93%), while the largest decrease came from Forest Products (-8.65%).
In the West, BNSF’s total volumes were up (+9.24%), with the largest increase coming from Grain (+56.48%), while the largest decrease came from Chemicals (-3.62%). UP’s total volumes were up (+7.61%), with the largest increase coming from Grain (+57.03%), while the largest decrease came from Forest Products (-3.25%).
In Canada, CN’s total volumes were up (+9.26%), with the largest increase coming from Grain (+37.89%), while the largest decrease came from Other (-37.95%). CPKCS’s total volumes were down (-21.63%), with the largest increase coming from Grain (+35.70%), while the largest decrease came from Forest Products (-69.79%).
Source Data: AAR – PFL Analytics
North American Rig Count Summary
Rig Count
North American rig count was up by +2 rigs week-over-week. The US rig count was unchanged week-over-week, but down by -41 rigs year-over-year. The US currently has 551 active rigs. Canada’s rig count was up by +2 rigs week-over-week, but down by -20 rigs year-over-year. Canada currently has 224 active rigs. Overall, year-over-year we are down by -61 rigs collectively.
We are watching a few things out there for you:
We are Watching Petroleum Carloads
The four-week rolling average of petroleum carloads carried on the six largest North American railroads rose to 29,673 from 29,173 which was an increase of +500 rail cars week-over-week. Canadian volumes rose. CN’s shipments were higher by +4.0% week-over-week, CPKC’s volumes were higher by +18.0% week-over-week. U.S. shipments were mixed. The BN had the largest percentage increase and was up by +10.0%. The CSX had the largest percentage decrease and was down by -3.0%.
We are Watching Canada
When Enbridge CEO Greg Ebel was asked last week about building a new West Coast oil pipeline, he did not mince words. The company spent C$600 million (roughly $440 million US) on the Northern Gateway project (never was built), watched the government pull the rug out when approval was overturned in 2016, and has no appetite to repeat the exercise. “That’s not the type of risk we are prepared to take on at this time,” Ebel said. That is as close to a flat no as you will hear from a CEO who still has to be diplomatic about these things.
The irony is that while Enbridge is declining to build new West Coast capacity, its existing Mainline system is under considerable pressure. The system averaged 3.1 million barrels per day in 2025 and was apportioned for nine of those twelve months, and already for both January and February of this year. Enbridge has sanctioned Mainline Line Optimization Phase 1 (MLO1), which will add 150,000 bpd of new capacity by October 2027, with MLO2 adding another 250,000 bpd in 2028. Those are welcome additions, but they are incremental fixes to a system that is already straining. The apportionment data last week confirms the situation has not improved: Enbridge rejected 13% of January heavy crude nominations at Kerrobert, Saskatchewan.
Meanwhile, Trans Mountain waterborne exports fell in January to an 11-month low of 390,000 b/d, the lowest since February 2025, as Chinese SPR buying that had supported prices through late 2025 eased. Chinese state-controlled firms may have added as much as 1.1 million b/d to China’s strategic petroleum reserve in December alone, and that demand has since faded. Heavy Canadian loadings from TMX to Asia-Pacific fell almost 22% from December. The result is that more Alberta barrels are being pushed back onto the Mainline and into US-bound flows rather than heading west. On a brighter note, Enbridge’s Line 5 reroute permit in Wisconsin was upheld by an administrative law judge on February 13, moving construction of the 41-mile reroute around the Bad River Band reservation closer to reality.
The April 1st carbon pricing deadline highlighted by Ebel remains a key near-term watch point. Producers need to understand Canada’s industrial carbon policy before committing to the kind of production growth that would stress the Mainline further. The Alberta government’s West Coast pipeline proposal targets federal submission by July 1st, but is structurally a decade away from moving molecules even in the best case. PFL will be watching how quickly MLO1 and MLO2 are absorbed and whether apportionment tightens further as new oilsands production hits the system.
We are Watching Cenovus
Three months after closing its $6.1 billion acquisition of MEG Energy, Cenovus has already captured the corporate synergies and is now focused on growing production in the field. The company produced a record 918,000 barrels of oil equivalent per day in Q4 2025, up 12% from Q4 2024, and exited the year with a monthly record of over 970,000 boe/d in December. The Q4 profit came in at C$934 million, up from C$146 million a year earlier. This is not a company that is slowing down.
The growth is coming from across the portfolio. Foster Creek hit a new record of 220,000 b/d in Q4, up from 195,000 b/d a year earlier, following completion of a 30,000 b/d optimization project ahead of schedule. Sunrise rose to 58,000 b/d, with three new well pads expected online this year. New to the Cenovus portfolio is Christina Lake North, formerly MEG’s Christina Lake asset, which averaged 110,000 b/d in Q4 for a record at that asset. CFO Kam Sandhar said on last Thursday’s earnings call that Cenovus plans to add approximately 40,000 b/d at Christina Lake North by 2028, growing total Christina Lake production to approximately 400,000 b/d, one of the largest single-asset production footprints in the oilsands.
What this means for pipeline and rail markets is more volume pressing against a system that, as noted above, is already apportioned. The question that matters for freight is whether MLO1 and MLO2 absorb the new barrels, or whether the system tips back toward differential widening that forces incremental production onto rail. The WCS-WTI differential has widened to 23-month highs, and the breakeven economics for crude-by-rail are essentially here right now. Cenovus’s production growth into a tightening Mainline is the single most important underlying driver of crude-by-rail economics in Western Canada over the next two years. PFL will be watching this one closely.
We are Watching the Supreme Court
On Friday of last week, the U.S. Supreme Court threw out most of the tariffs President Trump has imposed on nearly all U.S. trading partners, finding his ability to unilaterally impose tariffs exceeded his powers under the International Emergency Economic Powers Act (IEEPA). The ruling could have potentially sweeping implications for cross-border trade flows and, by extension, for the rail industry that moves goods across the Canada-US and Mexico-US borders.
The timing is almost darkly comic. Last Wednesday, the US House voted 219-211 to revoke Canada’s 25% tariffs through a congressional resolution, a largely symbolic gesture that Trump was expected to veto anyway. Six Republicans crossed the aisle. The White House called it “a fruitless exercise.” Within days, the Supreme Court effectively rendered the entire debate moot. If the ruling holds, the IEEPA-based tariff architecture, which is the legal foundation for the Canada, Mexico, and global tariffs, collapses.
For the rail industry, the immediate question is whether this translates to a recovery in cross-border freight volumes. CN Rail disclosed last week that tariff impacts cost the company more than $350 million in revenue in 2025, with forest products and metals hardest hit. Critically, CN CFO Ghislain Houle made those comments at a Citi conference on February 18th, before the Supreme Court ruling, describing the environment as “still very murky.” A removal of tariffs would directly address the uncertainty that has been causing shippers to defer cross-border commitments. CPKC CEO Keith Creel noted last week that “tariff tribulations” had pushed Canadian and Mexican companies to diversify away from US suppliers, creating demand for CPKC as a Canada-Mexico land bridge. That trade pattern could now partially reverse.
Important caveats apply. The Trump administration will almost certainly appeal, and whether the ruling applies retroactively or only prospectively matters enormously for pricing and contract decisions. The USMCA review scheduled for July is a separate process that proceeds regardless. Readers should watch for the administration’s formal response in the coming days, as that will clarify whether the Canada-specific tariffs are immediately suspended or remain in legal limbo. Over the weekend, Trump struck back, imposing a 15% across-the-board tariff on all countries under separate legal authority. The tariff story is not over. Stay tuned to PFL, we are watching this one closely!
We are Watching Canola
Readers will recall that last month, left-wing Prime Minister Carney returned from Beijing with a trade deal that included significant tariff relief on Canadian canola. The March 1 implementation date is now days away. As of that date, China’s tariffs on Canadian canola seed drop from approximately 84% to 15%, and the 100% tariffs on canola meal are removed entirely through at least year-end. Together, these changes are expected to restore access to nearly $7 billion in annual export markets for Canadian agriculture.
To understand the magnitude of what has been blocked, consider that Canadian canola exports to China were essentially zero from August 2025 onward, after China’s preliminary anti-dumping duties on canola seed hit 75.8%. An industry that had been shipping meaningful volumes to China annually effectively lost that market overnight. With the 2025 crop sitting in storage and spring planting decisions weeks away, the timing of this tariff relief is critical for producer confidence. The Supreme Court ruling discussed above introduces one wrinkle: if US tariffs on Canada are struck down, some of the political calculus that drove Carney to the China deal changes. The canola deal itself is separate and proceeds regardless, but the broader trade picture is shifting quickly.
The rail implication is real and near-term. Covered hopper demand from the prairies into the Pacific export terminals has been depressed since the tariffs hit. A resumption of meaningful canola flow to China, routed through Vancouver export terminals via CN and CPKC, would put cars back to work on a lane that has been underutilized for months. Analysts are rightly cautious, as the tariff relief on canola meal is only guaranteed through year-end, and canola oil remains excluded from the deal entirely. But even a partial restoration of China volumes would be a meaningful shot in the arm for covered hopper utilization. PFL has covered hopper exposure in Western Canada, and we will be monitoring closely as the first post-tariff shipments begin moving.
We are Watching the UP and the NS
On Monday of last week, the Union Pacific and the Norfolk Southern jointly notified the Surface Transportation Board that they intend to refile their $85 billion merger application by April 30, 2026. The original December filing was rejected in January as incomplete, with the STB saying it was missing forward-looking market share data and key terms of the merger agreement. UP CEO Jim Vena, speaking at a Wednesday investor conference, said the delay will not derail the timeline and the railroads still expect to close the transaction in early or mid-2027.
What is new is that CN and CPKC have publicly said they will fight hard for concessions as the price of the merger going through. CN CFO Ghislain Houle told a Citi conference on Tuesday of last week: “We’ll be as aggressive as we can be on asking for remedies and concessions.” CPKC CEO Keith Creel described having a “robust” list of demands, including more access to UP’s network in St. Louis and Kansas City, and specifically access to Houston’s chemical alley, the massive refinery and petrochemical complex along the Houston Ship Channel, currently operated by a UP-BNSF joint venture with no direct CPKC connection. Creel made clear he wants one.
For its part, UP had initially budgeted $750 million for potential concessions, but CFO Jennifer Hamann said last week that the deal’s inherent benefits make such concessions unnecessary. “We don’t think they’re necessary to make our point and to drive better enhanced competition,” Hamann said. That position is going to be tested hard. The merger would cover about 55,000 miles of track and roughly half of US freight traffic, and the 2001 STB rules require the merging carriers to demonstrate that competition is enhanced, not merely preserved. That higher bar is exactly what CN and CPKC intend to exploit. For shippers of refined products and petrochemicals, the Houston access question is the one to watch. PFL clients with USGC petrochemical exposure should be paying close attention to what the STB ultimately requires here.
We are Watching Trucking
The truckload market is sending signals that should matter to everyone in intermodal. On Wednesday of last week, the Federal Motor Carrier Safety Administration announced it had issued notices of proposed removal to over 550 CDL training schools following a five-day sting operation involving more than 300 investigators across all 50 states. The sweep included 1,426 on-site inspections and found schools operating with fake addresses, unqualified instructors, vehicles that did not match the training offered, and failures to properly train drivers on hazardous materials transport. Another 109 providers voluntarily withdrew from the national Training Provider Registry the moment investigators arrived. Transportation Secretary Sean Duffy put it bluntly: “For too long, the trucking industry has operated like the Wild, Wild West.”
This follows a December purge that removed nearly 3,000 providers. The cumulative effect on the available driver pool is becoming measurable. J.B. Hunt management said at a Barclays investor conference Tuesday of last week that truck capacity has “notably tightened” and that the market remains firm even in what is seasonally the weakest demand period of the year, a combination you simply do not see at the bottom of a freight cycle. CFO Brad Delco described demand as trending “a little bit more positive” than the company had expected heading into the year, even without the demand-side help that would typically drive this kind of tightening.
For intermodal, this is the setup that practitioners have been waiting for after three years of freight recession. J.B. Hunt reported two-year stacked intermodal growth rates in the high single digits throughout 2025, with Q4 up 11%, and that growth happened during a period of excess truck capacity and low fuel prices. As those tailwinds reverse, the intermodal value proposition only gets stronger. NS’s new CMA CGM partnership, announced mid-week last week, offers a door-to-door “truck-like” intermodal product on West Coast-Midwest lanes under the Triple Crown brand, smart positioning for exactly this environment. PFL’s intermodal exposure stands to benefit if capacity tightening accelerates into spring bid season, as many in the market now expect.
We are Watching Key Economic Indicators
Gross Domestic Product (“GDP”)
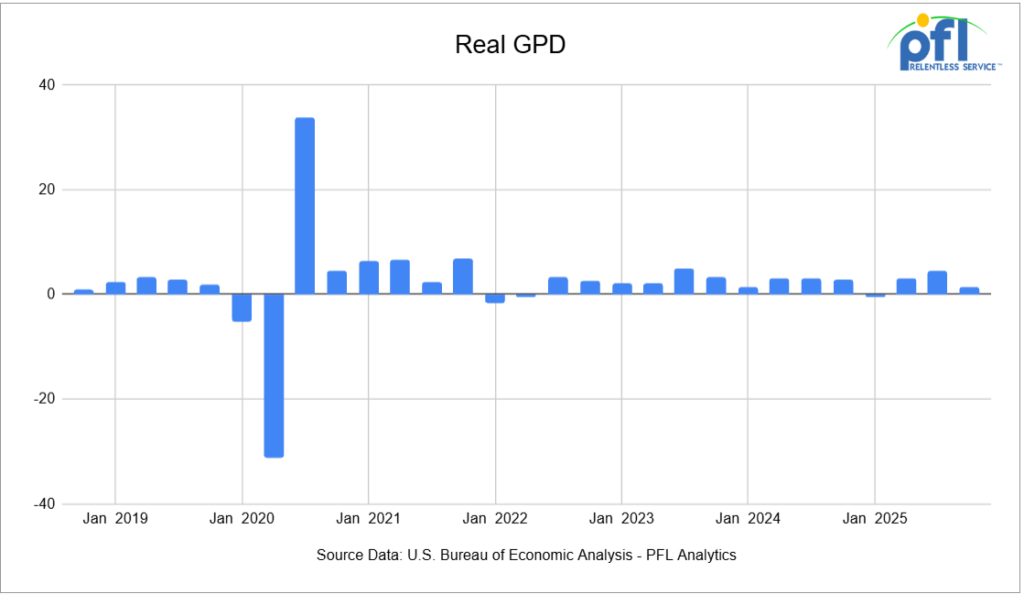
Real GDP in the United States grew at an annualized rate of 1.4% in the fourth quarter of 2025 (covering October through December), according to the advance estimate from the U.S. Bureau of Economic Analysis. This marks a notable slowdown from the 4.4% growth seen in Q3 2025, reflecting weaker government spending and export activity alongside still-positive consumer demand.
Consumer spending (measured by personal consumption expenditures) rose 2.4% in Q4 2025, down from a 3.5% pace in the previous quarter, and contributed approximately +1.6 percentage points to overall GDP growth. Investment also made a positive contribution, while government spending and exports declined, acting as a drag on overall growth. Imports fell, which provided a small positive effect on the GDP calculation because imports are subtracted in the GDP formula.
Consumer spending rose during the quarter, supported by gains in services such as healthcare and other non-durable sectors, though the pace of increase was lower compared with earlier in 2025. Other components of domestic demand—including fixed investment—added modestly to growth, but the overall slower pace of activity indicates weakening momentum at the end of the year.
Real final sales to private domestic purchasers (the sum of household consumption and fixed investment) increased 2.4% in Q4 2025, compared with a stronger 2.9% pace in Q3 2025, indicating that underlying private demand expanded at a more moderate rate late in the year but remained a notable contributor to economic activity.
On the price front, the price index for gross domestic purchases rose 3.7%, while the PCE price index increased 2.9% and core PCE (excluding food and energy) rose 2.7% in Q4. These inflation figures suggest persistent price pressures even as growth slowed.
Consumer Spending
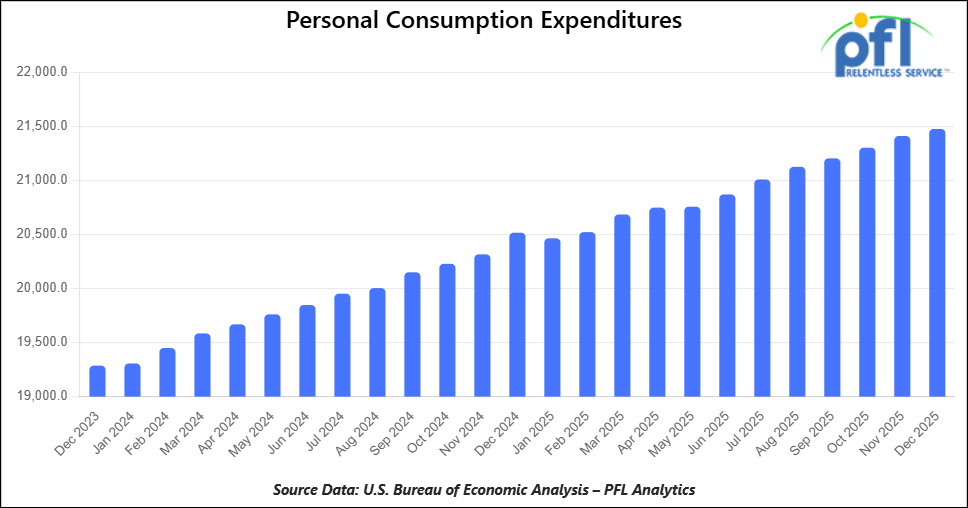
In December 2025, total consumer spending continued to expand, with personal consumption expenditures (PCE) rising 0.4 percent from November 2025, reflecting steady household demand late in the year. Current-dollar PCE increased by $91.0 billion, driven by a $98.5 billion rise in services outlays that more than offset a $7.5 billion decline in goods spending. Real (inflation-adjusted) PCE rose 0.1%in December.
The personal saving rate declined to 3.6 percent in December, down from September and early-fall levels, as consumer outlays continued to outpace growth in disposable income.
On inflation, the PCE price index — the Federal Reserve’s preferred inflation gauge — rose 0.4 percent month-over-month in December and 2.9 percent year-over-year, accelerating from earlier in the autumn. Excluding food and energy, the core PCE price index also rose 0.4 percent month-over-month and 3.0 percent year-over-year, indicating persistent underlying price pressures above the Fed’s long-run 2%target.
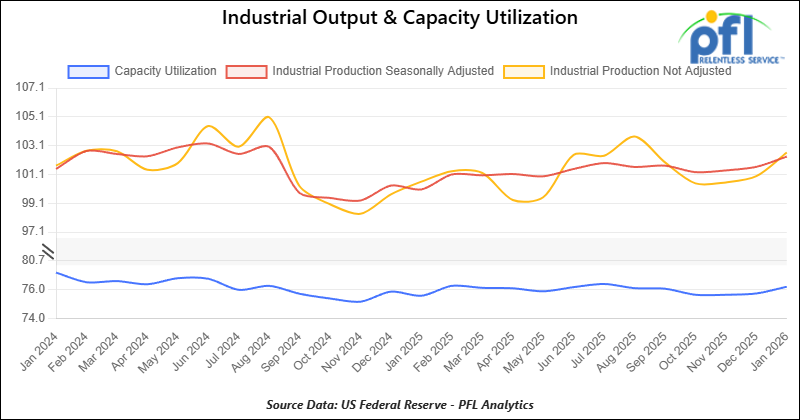
Industrial Output and Capacity Utilization
Manufacturing accounts for approximately 75% of total output. Manufacturing output in January 2026 was up 0.6% from December 2025. Overall industrial production rose 0.7% month-over-month in January 2026 after a 0.2% rise in December.
Capacity utilization is a measure of how fully firms are using machinery and equipment. Capacity utilization increased from December to January 2026 — total industry moved up to about 76.2% in January, and manufacturing utilization edged up to about 75.6%.
Lease Bids
- 100, 21.9K 117J Tanks located off of All Class 1s in Midwest. For use in CO2 service. Period: 6 months.
- 30-50, 30K 117J Tanks located off of NS or CSX in Northeast. For use in C5 service. Period: 1 year.
- 20-50, 4000-5000 Covered Hoppers located off of UP or BN in Houston. For use in Urea, Potash, Ammonium Sulfate service. Period: 6-12 Months.
- 200, 33K Pressure Tanks located off of CSX or NS in Ohio. For use in Propylene service. Period: 18 Months.
- 30-50, 25.5K Dot 111 Tanks located off of All Class 1s in Anywhere. For use in Asphalt service. Period: 1-3 Years.
Sales Bids
- 28, 3400CF Covered Hoppers located off of UP BN in Texas. For use in Cement service. Cement Gates needed.
- 20, 17K DOT111 Tanks located off of various class 1s in various locations. For use in corn syrup service.
- 120, Various Open-Top Aluminum Rotary Gondolas located off of various class 1s in various locations. For use in Sulphur service. Built 2004 or later.
- 30, 29K DOT111 Tanks located off of various class 1s in Chicago. For use in Veg Oil service.
Lease Offers
- 100, 30K CPC1232 Tanks located off of UP or BN in Texas. Last used in Diesel.
- 100, 30K DOT117R Tanks located off of UP or BN in Texas. Last used in Gasoline.
- 100, 29K DOT117R Tanks located off of UP or BN in Texas. Last used in Gasoline. Coiled and Insulated.
- 21, 6351 Covered Hoppers located off of CN in Wisconsin. Last used in DDG. Available until February 2027.
- 29, 6500 Covered Hoppers located off of CN in Wisconsin. Last used in DDG. Available until February 2027.
- 50, 20K DOT117J Tanks located off of All Class 1s in Moving. Last used in Styrene.
- 29, 25.5K DOT117J Tanks located off of UP or BN in Texas. Cars are currently clean. Cars are currently clean.
- 90, 30K DOT117J Tanks located off of UP or BN in Corpus Christie. Last used in Diesel.
- 200, 340W DOT 112J Tanks located off of All Class 1s in Multiple Locations. Last used in Propane and Butane. Cars are currently clean.
- 15, 6200CF Covered Hoppers located off of All Class 1s in Wisconsin. Last used in Plastic. Cars are currently clean.
- 30, 6500CF Covered Hoppers located off of All Class 1s in Wisconsin. Last used in Plastic. Cars are currently clean.
- 50, 30K DOT117J Tanks located off of UP or BN in Corpus Christie. Last used in Gasoline.
- 24, 21K Stainless Steel Tanks located off of UP in Texas / Mexico Border. Last used in SULFACTANT. Cars are currently clean.
- 34, 30K DOT 111 Tanks located off of UP in Texas / Mexico Border. Last used in Veg Oil. Cars are currently clean.
Sales Offers
- 50, 31.8K CPC1232 Tanks located off of UP or BN in TX. Last used in Multiple. Requal Due in 2025.
- 35, 3400CF Covered Hoppers located off of UP or BN in Midwest. Last used in Sand.
- 25, 30K 117J Tanks located off of CSX in Jackson, TN. Last used in Fuels. Newly Requalified.
Call PFL today to discuss your needs and our availability and market reach. Whether you are looking to lease cars, lease out cars, buy cars, or sell cars call PFL today at 239-390-2885
Live Railcar Markets
| CAT | Type | Capacity | GRL | QTY | LOC | Class | Prev. Use | Offer | Note |
|---|
PFL will be at the Following Conferences
- Where: La Quinta, CA
- Attending: David Cohen (954-729-4774)
- Conference Website
- Where: Hyatt Regency Dallas in Dallas, TX
- Attending:Curtis Chandler (239.405.3365), David Cohen (954-729-4774), Brian Baker (239.297.4519), Cyndi Popov(403) 402-5043
- Conference Website
The post PFL Railcar Report 2-23-2026 appeared first on PFL Petroleum Services LTD.
]]>The post PFL Railcar Report 2-17-2026 appeared first on PFL Petroleum Services LTD.
]]>Carl Jung
Jobs Update
- Initial jobless claims seasonally adjusted for the week ending February 7, 2026 came in at 227,000, versus the adjusted number of 232,000 people from the week prior, down 5,000 people week over week.

- Continuing jobless claims came in at 1,862,000, versus the adjusted number of 1,841,000 people from the week prior, up 21,000 week-over-week.

Stocks closed mixed on Friday of last week and lower week-over-week
The DOW closed higher on Friday of last week, up 48.95 points (0.10%), closing out the week at 49,500.93, down -614.74 points week-over-week. The S&P 500 closed higher on Friday of last week, up 3.41 points (0.05%), and closed out the week at 6,836.17, down -96.13 points week-over-week. The NASDAQ closed lower on Friday of last week, down -50.48 points (-0.22%), and closed out the week at 22,546.67, down -484.54 points week-over-week.
In overnight trading, DOW futures traded higher and are expected to open at 49,486 this morning, down 83 points from Friday’s close.
Crude oil closed higher on Friday of last week, but lower week-over-week
West Texas Intermediate (WTI) crude closed up +5 cents per barrel (0.1%), to close at $62.89 on Friday of last week, but down -66 cents week-over-week. Brent crude closed up +23 cents per barrel (0.3%), to close at $67.75, and down -30 cents week-over-week.
One Exchange WCS (Western Canadian Select) for March delivery settled on Friday of last week at US$15.80 below the WTI-CMA (West Texas Intermediate – Calendar Month Average). The implied value was US$46.79 per barrel.
U.S. commercial crude oil inventories (excluding those in the Strategic Petroleum Reserve) increased by 8.5 million barrels week-over-week. At 428.8 million barrels, U.S. crude oil inventories are 3% below the five-year average for this time of year.
Total motor gasoline inventories increased by 1.2 million barrels week-over-week and are 4% above the five-year average for this time of year.

Distillate fuel inventories decreased by 2.7 million barrels week-over-week and are 4% below the five-year average for this time of year.
Propane/propylene inventories decreased 5.4 million barrels week-over-week and are 36% above the five-year average for this time of year.

Propane prices closed at 62.6 cents per gallon on Friday of last week, down 2.6 cents per gallon week-over-week, and down 29.6 cents year-over-year.

Overall, total commercial petroleum inventories decreased by 1.7 million barrels week-over-week, during the week ending February 6, 2026.
U.S. crude oil imports averaged 6.8 million barrels per day last week, an increase of 604,000 barrels per day week-over-week. Over the past four weeks, crude oil imports averaged about 6.3 million barrels per day, 5% less than the same four-week period last year. Total motor gasoline imports (including both finished gasoline and gasoline blending components) averaged 365,000 barrels per day, and distillate fuel imports averaged 151,000 barrels per day during the week ending February 6, 2026.

U.S. crude oil exports averaged 3.739 million barrels per day during the week ending February 6, 2026, a decrease of 308,000 barrels per day week-over-week. Over the past four weeks, crude oil exports averaged 4.016 million barrels per day.
U.S. crude oil refinery inputs averaged 16 million barrels per day during the week ending February 6, 2026, which was 29,000 barrels per day less week-over-week.

WTI is poised to open at $63.67, up 92 cents per barrel from Friday’s close.
North American Rail Traffic
Week Ending February 11, 2026:
Total North American weekly rail volumes were down (-5.01%) in week 7, compared with the same week last year. Total Carloads for the week ending February 11, 2026 were 306,102, down (-4.40%) compared with the same week in 2025, while weekly Intermodal volume was 335,686, down (-5.55%) year over year. 9 of the AAR’s 11 major traffic categories posted year-over-year decreases. The largest decrease came from Forest Products (-22.15%). The largest increase was Grain (+9.07%).
In the East, CSX’s total volumes were down (-4.30%), with the largest decrease coming from Coal (-22.93%), while the largest increase came from Intermodal Units (+2.22%). NS’s total volumes were down (-10.61%), with the largest increase coming from Petroleum & Petroleum Products (+6.43%), while the largest decrease came from Coal (-25.60%).
In the West, BNSF’s total volumes were up (+0.91%), with the largest increase coming from Petroleum & Petroleum Products (+23.92%), while the largest decrease came from Coal (-24.31%). UP’s total volumes were down (-3.50%), with the largest increase coming from Grain (+17.59%), while the largest decrease came from Forest Products (-12.68%).
In Canada, CN’s total volumes were up (+5.24%), with the largest increase coming from Grain (+35.16%), while the largest decrease came from Other (-31.10%). CPKCS’s total volumes were down (-30.42%), with the largest increase coming from Other (+16.22%), while the largest decrease came from Forest Products (-66.99%).
Source Data: AAR – PFL Analytics
North American Rig Count Summary
Rig Count
North American rig count was down by -6 rigs week-over-week. The U.S. rig count was unchanged week-over-week, but down by -37 rigs year-over-year. The U.S. currently has 551 active rigs. Canada’s rig count was down by -6 rigs week-over-week and down by -23 rigs year-over-year. Canada currently has 222 active rigs. Overall, year-over-year we are down by -60 rigs collectively.

We are watching a few things out there for you:
We are Watching Petroleum Carloads
The four-week rolling average of petroleum carloads carried on the six largest North American railroads fell to 29,173 from 29,625 which was a decrease of -452 rail cars week-over-week. Canadian volumes were mixed. CN’s shipments were lower by -2.0% week-over-week, CPKC’s volumes were higher by +3.0% week-over-week. U.S. shipments were also mixed. The NS had the largest percentage increase and was up by +9.0%. The CSX had the largest percentage decrease and was down by -6.0%.
We are Watching Canadian Crude Flows
Canadian oil exports hit record levels while crude-by-rail collapsed to eight-year lows, highlighting how dramatically the Trans Mountain expansion has reshaped North American energy logistics.
Fresh data released from Stats Canada last week confirms the scale of the shift. Canada exported 4.44 million barrels per day in November, up from 4.21 million b/d a year earlier, according to Statistics Canada. But, the story beneath that headline is striking: exports to non-U.S. countries nearly tripled to 676,000 b/d, up from just 234,000 b/d in November 2024. Asian demand drove the surge, with the expanded Trans Mountain pipeline finally providing meaningful waterborne access to Pacific markets. The 890,000 b/d system, which came online in May 2024 after adding 590,000 b/d of capacity, now moves roughly 15% of Canada’s total crude exports to buyers that don’t require routing through the United States.
Alberta production hit a record 4.4 million b/d in November of 2025, and Prime Minister Carney has made expanding energy exports to China and India a centerpiece of his effort to reduce dependence on U.S. markets. Trans Mountain plans further expansions totaling 300,000 b/d, with the first 100,000 b/d increase targeted for January 2027. Meanwhile, Alberta wants to build another pipeline to the west coast with at least 1 million b/d of capacity.
The flip side – Rail has been pushed to the margins. Canadian crude-by-rail exports averaged just 88,700 b/d in 2024, down 10% from 2023. So far in 2025 (still waiting on December data from the Canadian Energy Regulator) the country has exported an average of 76,791 barrels per day – lowest level since 2016, according to Canada Energy Regulator data. Rail becomes economic only when WCS-WTI differentials widen past certain thresholds, and with differentials narrowing post -TMX, the math doesn’t work for most shippers in this low priced crude environment we seem to find ourselves in.
We are Watching Trump
President Trump is privately weighing whether to withdraw from the CUSMA trade pact he negotiated, according to reports last week. The move would mark one of the most significant reversals in North American trade policy in decades and would immediately disrupt cross-border rail traffic that has operated under relatively stable rules since 1994.
Five Republicans broke ranks last Wednesday to join Democrats in blocking an extension of tariffs on Canadian goods, delivering a blow to House Speaker Mike Johnson, who had been holding the line on Trump’s trade measures. Johnson later said that Trump could veto any tariff rollback if it reaches his desk, but the congressional pushback signals eroding support for the administration’s trade war even within the president’s own party. Senate Democratic leader Chuck Schumer said both chambers have now rejected Trump’s “phony emergency and fabricated trade war,” while the Republican-controlled Senate also voted to abandon tariffs on Brazil and other emergency global duties.
The Supreme Court is expected to rule on the legality of Trump’s tariffs as soon as February 20, which could force the administration’s hand one way or another.
For railroads, CUSMA withdrawal would be catastrophic. Cross-border rail movements between the U.S., Canada, and Mexico have grown substantially under the agreement, with integrated supply chains depending on predictable tariff-free treatment. Automotive parts routinely cross borders multiple times during production. Grain, energy products, and intermodal containers move seamlessly north and south. A sudden shift to World Trade Organization rules or worse would inject massive uncertainty into routing decisions, pricing, and long-term contracts.
Even the threat of withdrawal creates problems. Shippers are already dealing with the policy whiplash from conflicting signals out of Washington. Now they have to game out scenarios where the foundational trade framework for North America simply disappears. PFL clients moving cross-border freight need to stay close to this. L Give the desk a call, we can help you!
We are Watching Trucking
Intermodal is having a moment, and it’s not because freight demand is surging. It’s because trucking capacity is bleeding out.
Spot rates and tender rejections stayed elevated despite volumes running 6-7% below year-ago levels, a clear signal the market shift is supply-driven, not demand-led. Carriers continue leaving lanes and reducing fleets after years of attrition and stretched balance sheets. The result: higher spot rates, rising tender rejections, and greater route-guide noncompliance even with weak baseline volumes post-holiday.
Shippers are responding by moving freight to intermodal where the lanes make sense. C.H. Robinson reported “interest in converting truckload shipments to intermodal surged“ due to tightening over-the-road capacity, a trend continuing into RFP season as shippers target cost savings on longer hauls where intermodal pencils. Railroads are holding pricing relatively flat, keeping intermodal competitive with truckload rates and maintaining service metrics that have been solid for 30 consecutive weeks.
This isn’t about intermodal stealing share through better service or lower prices. It’s about trucking’s structural capacity problems making rail look attractive again. Union Pacific cut its priority LA-to-Chicago service to three days. BNSF and CSX introduced nine new intermodal schedules from California to the Ohio Valley and Northeast. Norfolk Southern and UP launched new outbound service from Louisville to the West Coast. These moves are tactical responses to demand that’s flowing their way because over-the-road alternatives are either unavailable or prohibitively expensive.
U.S. rail intermodal volume fell 3.4% in December 2025 from a year earlier, the fourth consecutive month of year-over-year decline, so it’s not like the sector is booming. But, the setup for 2026 looks better than it did six months ago, largely because the trucker pain is real and likely to persist. If contract trucking rates move up in the back half, intermodal could see volume growth for the first time since early 2025.
For PFL’s intermodal customers, now is a good time to lock in coverage on longer lanes. The pricing window won’t stay open if trucking starts adding capacity.
We are Watching Coal
Coal was supposed to fade cleanly. Instead, it’s a stubborn, cash-flow-relevant anomaly. While U.S. power generation continues a long-term shift away from coal, demand has proven highly sensitive to stress: weather events, export market volatility, grid reliability concerns, and geopolitical energy shocks. Railroads sit squarely in the middle of that stress response.
One important nuance is export coal, particularly metallurgical coal used in steelmaking. When global steel demand rises or supply disruptions hit Australia or Russia, U.S. coal suddenly becomes marginal supply again. These swings translate directly into rail volume surges on corridors feeding East Coast and Gulf export terminals. Unlike domestic utility coal, export volumes tend to move long distances at higher rates, making them disproportionately profitable even at modest volume levels.
What makes coal uniquely attractive to railroads at this stage is not growth, but capital efficiency. The infrastructure is fully depreciated. The locomotives, crews, and terminals already exist. Incremental coal traffic flows through networks with minimal incremental cost, producing strong contribution margins even as total coal volumes trend downward. In effect, coal has become a harvest asset: one that railroads no longer optimize for growth, but one they are happy to monetize as long as it shows up. Investors may discount coal’s future, but the cash it throws off today helps fund dividends, buybacks, and capital investment elsewhere on the network.
Coal’s persistence is also being reinforced by policy intervention. DOE forced Consumers Energy to delay closure of its J.H. Campbell coal plant in Michigan. When one large facility is forced to remain online, it tightens coal supply logistics across a broader regional system. Mines remain active longer than planned, rail contracts are extended rather than wound down, and supporting infrastructure stays utilized. In the Midwest and parts of the Southeast, railroads have seen coal volumes stabilize and in certain corridors modestly rebound, not because demand is growing structurally, but because retirements are proving harder to execute than anticipated.
Utilities are quietly reassessing closure timelines as reserve margins shrink and peak-load risk rises. While few are announcing outright reversals, several are delaying decommissioning, maintaining dual-fuel flexibility, or running coal units at higher capacity factors during periods of stress. Each of those decisions translates directly into incremental rail carloads that were assumed to be gone.
From the railroads’ perspective, the impact is disproportionately positive. Coal traffic moves in long, dense unit trains that efficiently absorb network capacity. Even flat or slightly higher volumes can meaningfully support cash flow because the cost structure is already in place and largely depreciated. Unlike growth commodities that require new terminals or equipment, coal simply keeps moving on rails that were built decades ago and never stopped working.
The takeaway is not that coal is “back,” but that it is exiting more slowly and opportunistically than consensus models suggest. As long as utilities prioritize reliability, railroads will continue to extract value from a commodity that was supposed to have already left the building.
We are Watching Left Wing Carney
Prime Minister Mark Carney made a significant policy reversal on November 27th, when he signed a memorandum of understanding with Alberta that allows enhanced oil recovery (EOR) projects to qualify for federal carbon capture tax credits. Ottawa had explicitly banned this since 2021. The move ties Alberta’s massive $16.5 billion Pathways Alliance carbon capture project directly to approval of a new oil pipeline to the West Coast. Neither can proceed without the other.
Here’s the thing: this is how carbon capture should have been done all along. Enhanced oil recovery kills two birds with one stone. You permanently store industrial CO₂ emissions underground while extracting additional oil from depleting reservoirs. Pure carbon storage, where you capture CO₂ and just bury it, is economically stupid when you can use that same captured carbon to increase oil production and extend the life of mature fields. It is already done successfully at sites like Whitecap Resources’ facility near Estevan, Saskatchewan, which uses CO₂ purchased from the coal-fired Boundary Dam Power Station.
How Enhanced Oil Recovery Works: CO₂ captured from industrial emitters can be separated, compressed, and transported via pipeline or rail to mature oil fields. Once it reaches the injection site, the CO₂ is pumped into depleting reservoirs, creating increased pressure that pushes additional oil to the surface. The CO₂ remains permanently stored underground. It’s not released back into the atmosphere. This is a true win-win: you sequester carbon AND produce more oil from fields that would otherwise be abandoned.
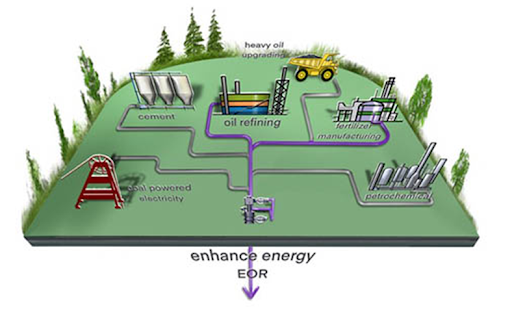
Once the CO₂ reaches its destination it is injected into the depleting reservoir.
Alberta Carbon Trunk Line (ACTL), completed in 2020, demonstrates this works at scale. It’s the world’s largest capacity CO₂ pipeline, capable of transporting up to 14.6 million tonnes of CO₂ per year. That represents 20% of all current oil sands emissions or the equivalent of capturing CO₂from more than 2.6 million cars. The system captures CO₂ at the North West Redwater Partnership Sturgeon Refinery and Nutrien’s Redwater Fertilizer Facility, then transports it to mature oil fields for injection. It works. It’s profitable. And it should have been the model from day one.
Carney’s policy shift now allows projects like Pathways Alliance to access federal investment tax credits covering up to 50 percent of capital costs, with Alberta adding another 12 percent. The Pathways project would build a 400-kilometer pipeline connecting over 20 oilsands facilities to an underground storage hub near Cold Lake, Alberta. The federal government had previously refused to subsidize EOR, insisting that carbon capture projects could only receive tax credits for “pure” storage where the CO₂ is buried and left alone.
That policy was never a very good one. If you’re going to spend billions capturing industrial carbon emissions, why NOT use it productively? The carbon stays underground either way, but with EOR you get economic value from enhanced production. Canada already possesses world-leading carbon capture technology. The ACTL system proves the infrastructure can be built and operated profitably.
The Rail Angle:
If EOR scales up as promised, it could create demand for specialized railcars to transport compressed CO₂ from industrial capture facilities to injection sites although these cars are very expensive to build. This is important for emitters not directly connected to pipeline infrastructure. You need pressure cars rated for supercritical CO₂, and you need a lot of them if this expands beyond the Pathways project. Could be new demand for rail equipment and logistics that doesn’t currently exist at scale.
So Is Carney Waking Up? Maybe. But we’re skeptical. Carney has publicly admitted Canada will miss its 2030 and 2035 climate targets under current policies. The proof will be in Carney’s actions. Does the Pathways project actually get built, or does it stall out over operational cost disputes like it did under Trudeau? Does the promised West Coast pipeline materialize, or does environmental opposition kill it? Does Alberta’s industrial carbon price stay frozen at $95 per tonne, undermining the entire economic case for carbon capture?
Carney may have finally figured out that EOR is the only economically viable path for large-scale carbon capture in Canada’s oil patch. But figuring it out in late 2025, after years of banning EOR from federal subsidies, means we’ve lost half a decade when this infrastructure could have been getting built. If he’s serious, we’ll see shovels in the ground soon. If not, this is just another announcement designed to keep Alberta happy while accomplishing nothing.
Whether Carney has the political will to build at scale, or if this is just window dressing to deflect criticism while he approves more pipelines, remains to be seen.
In other Carney news, he scrapped the Trudeau-era electric vehicle mandate on February 5th, the policy requiring 100% of new vehicle sales to be electric by 2035, and replaced it with a rebate program and vague emissions standards. Carney paused the mandate back in September for a “60-day review,” spent the fall insisting Canada needed binding targets, then killed it entirely. In its place? A $2.3 billion rebate scheme offering $5,000 for EVs and $2,500 for plug-in hybrids, but only in 2026, declining annually until it expires in 2030. The $50,000 price cap excludes most vehicles Canadians actually want to buy, and the program only covers imports from free-trade countries, meaning the 49,000 Chinese EVs Carney just negotiated access to won’t qualify.
The charging infrastructure spend of $1.5 billion through the Canada Infrastructure Bank sounds impressive until you realize Ottawa has been funding charger buildouts since 2016 and EV adoption is still stuck at 11% of new sales. Government officials admitted they haven’t modeled the emissions impact, which replaces binding 2026 sales targets with “aspirational” goals of 75% EV sales by 2035 and 90% by 2040. Carney claims new tailpipe standards will deliver equivalent reductions, but the details won’t be published until later this year. Bottom line Carney still wants Canadians to drive electric vehicles but realized the original targets were not in line with reality or what people really want. This new scheme is just putting lipstick on a pig, in our opinion.
For the rail sector, this policy chaos matters less for what it does than for what it represents. Carney’s approach to EVs is the same playbook he’s running on energy policy writ large. The mandate’s death won’t meaningfully impact finished vehicle imports by rail; most Canadian-bound autos move by truck or are assembled domestically. But, Carney’s willingness to capitulate to industry lobbying while maintaining retaliatory tariffs on U.S. vehicles creates exactly the kind of policy uncertainty that strangles investment decisions. You can’t plan a supply chain when the government changes direction every quarter.
We are Watching Wabtec
Last week, Wabtec announced nearly $1.8 billion in locomotive agreements with CSX and Union Pacific, a clear sign the big railroads are focused on running leaner, not necessarily bigger.
CSX signed a $670 million agreement that includes 100 new locomotives, upgrades to 50 existing units, and expanded digital systems. A big piece of that is converting older DC locomotives to more efficient AC traction, improving pulling power and fuel burn while extending the life of assets already on the books.
Union Pacific followed with a $1.2 billion modernization program, centered on upgrading its AC4400 fleet with updated propulsion systems and diagnostics to improve reliability and efficiency over time.
This isn’t about expanding fleets, it’s about tightening operations. Class I railroads are improving fuel efficiency, extending asset life, investing in digital performance tools, and strengthening reliability. That suggests a steady-demand environment where protecting margins and maintaining service consistency matter more than rapid growth.
For shippers, especially in bulk and energy markets, better locomotive performance typically translates into more predictable network performance and fewer operational surprises.Even with freight growth remaining moderate, Class I railroads are putting real capital behind efficiency, signaling confidence in long-term demand and a clear commitment to operational performance.
We are watching Key Economic Indicators
Unemployment Rate
On February 11, 2026, the BLS reported that 130,000 net new jobs were created in January 2026. Job gains were concentrated in health care, social assistance, and construction, while some sectors like federal government and financial activities saw losses.
Figures for prior months were revised sharply lower, with 2025’s net new job gains adjusted down from 584,000 to approximately 181,000, marking one of the weakest years for U.S. job growth in decades.
The official unemployment rate declined slightly to 4.3% in January 2026, down from 4.4% in December 2025.
Lease Bids
- 30-50, 6000cf Steel Hopper located off of CSX or NS in East. For use in petcoke service. Period: 5 Years.
- 10, 2500CF Open Top Hopper located off of UP or BN in Texas. For use in aggregate service. Period: 5 years. Need Rapid Discharge Doors.
- 100, 21.9K 117J Tank located off of All Class 1s in Midwest. For use in CO2 service. Period: 6 months.
- 30-50, 30K 117J Tank located off of NS or CSX in Northeast. For use in C5 service. Period: 1 year.
- 20-50, 4000-5000 Covered Hopper located off of UP or BN in Houston. For use in Urea, Potash, Ammonium Sulfate service. Period: 6-12 Months.
Sales Bids
- 28, 3400CF Hopper Covered located off of UP BN in Texas. For use in Cement service. Cement Gates needed.
- 20, 17K Tank DOT111 located off of various class 1s in various locations. For use in corn syrup service.
- 120, Various Gondola Open-Top Aluminum Rotary located off of various class 1s in various locations. For use in Sulphur service. Built 2004 or later.
- 30, 29K Tank DOT111 located off of various class 1s in Chicago. For use in Veg Oil service.
Lease Offers
- 100, 30K CPC1232 Tanks located off of UP or BN in Texas. Last used in Diesel.
- 100, 30K DOT117J Tanks located off of UP or BN in Texas. Last used in Gasoline.
- 100, 29K DOT117J Tanks located off of UP or BN in Texas. Last used in Gasoline. Coiled and Insulated.
- 21, 6351 Covered Hopper located off of CN in Wisconsin. Last used in DDG. Available until February 2027.
- 29, 6500 Covered Hopper located off of CN in Wisconsin. Last used in DDG. Available until February 2027.
- 50, 20K DOT117J Tank located off of All Class 1s in Moving. Last used in Styrene.
- 29, 25.5K DOT117J Tank located off of UP or BN in Texas. Cars are currently clean. Cars are currently clean.
- 90, 30K DOT117J Tank located off of UP or BN in Corpus Christie. Last used in Diesel.
- 200, 340W DOT 112J Tank located off of All Class 1s in Multiple Locations. Last used in Propane and Butane. Cars are currently clean.
- 15, 6200CF Covered Hopper located off of All Class 1s in Wisconsin. Last used in Plastic. Cars are currently clean.
- 30, 6500CF Covered Hopper located off of All Class 1s in Wisconsin. Last used in Plastic. Cars are currently clean.
Sales Offers
- 50, 31.8K CPC1232 Tanks located off of UP or BN in TX. Last used in Multiple. Requal Due in 2025.
- 100, 4600CF Open Top Hoppers located off of BN or CSX in Southeast. Last used in Coal.
- 35, 3400CF Covered Hoppers located off of UP or BN in Midwest. Last used in Sand.
- 25, 30K 117J Tanks located off of CSX in Jackson, TN. Last used in Fuels. Newly Requalified.
Call PFL today to discuss your needs and our availability and market reach. Whether you are looking to lease cars, lease out cars, buy cars, or sell cars call PFL today at 239-390-2885
Live Railcar Markets
| CAT | Type | Capacity | GRL | QTY | LOC | Class | Prev. Use | Offer | Note |
|---|
PFL will be at the Following Conferences
- Where: La Quinta, CA
- Attending: David Cohen (954-729-4774)
- Conference Website
- Where: Hyatt Regency Dallas in Dallas, TX
- Attending:Curtis Chandler (239.405.3365), David Cohen (954-729-4774), Brian Baker (239.297.4519), Cyndi Popov(403) 402-5043
- Conference Website
The post PFL Railcar Report 2-17-2026 appeared first on PFL Petroleum Services LTD.
]]>The post PFL Railcar Report 2-9-2026 appeared first on PFL Petroleum Services LTD.
]]>Jobs Update
- Initial jobless claims seasonally adjusted for the week ending January 31, 2026 came in at 231,000, versus the adjusted number of 209,000 people from the week prior, up 22,000 people week over week.
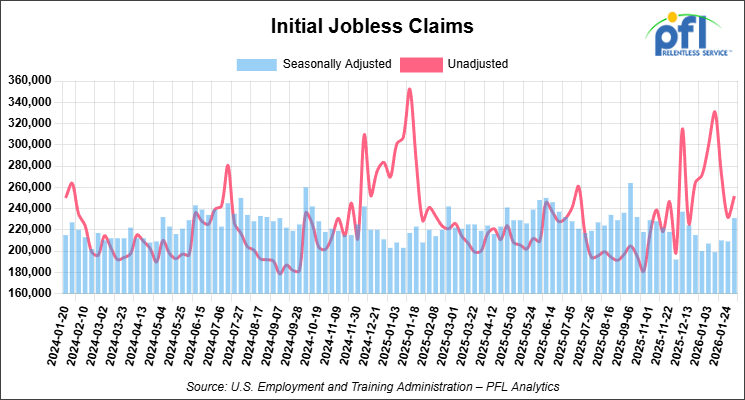
- Continuing jobless claims came in at 1,844,000, versus the adjusted number of 1,819,000 people from the week prior, up 25,000 week-over-week.
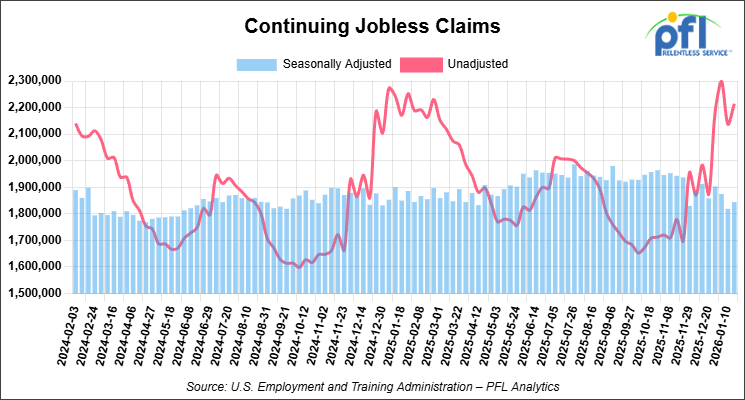
Stocks closed higher on Friday of last week and mixed week-over-week
The DOW closed higher on Friday of last week, up 1,206.95 points (2.47%), closing out the week at 50,115.67, up 1,223.20 points week-over-week. The S&P 500 closed higher on Friday of last week, up 133.90 points (1.97%), and closed out the week at 6,932.30, down -6.73 points week-over-week. The NASDAQ closed higher on Friday of last week, up 490.63 points (2.18%), and closed out the week at 23,031.21, down -430.61 points week-over-week.
In overnight trading, DOW futures traded higher and are expected to open at 50,156 this morning, down 49 points from Friday’s close.
Crude oil closed higher on Friday of last week and lower week-over-week
West Texas Intermediate (WTI) crude closed up 26 cents per barrel (0.4%), to close at $63.55 on Friday of last week, but down $1.66 week-over-week. Brent crude closed up 50 cents per barrel (0.7%), to close at $68.05, but down $2.64 week-over-week.
One Exchange WCS (Western Canadian Select) for March delivery settled on Friday of last week at US$15.30 below the WTI-CMA (West Texas Intermediate – Calendar Month Average). The implied value was US$47.62 per barrel.
U.S. commercial crude oil inventories (excluding those in the Strategic Petroleum Reserve) decreased by 3.5 million barrels week-over-week. At 420.3 million barrels, U.S. crude oil inventories are 4% below the five-year average for this time of year.

Total motor gasoline inventories increased by 700,000 barrels week-over-week and are 4% above the five-year average for this time of year.
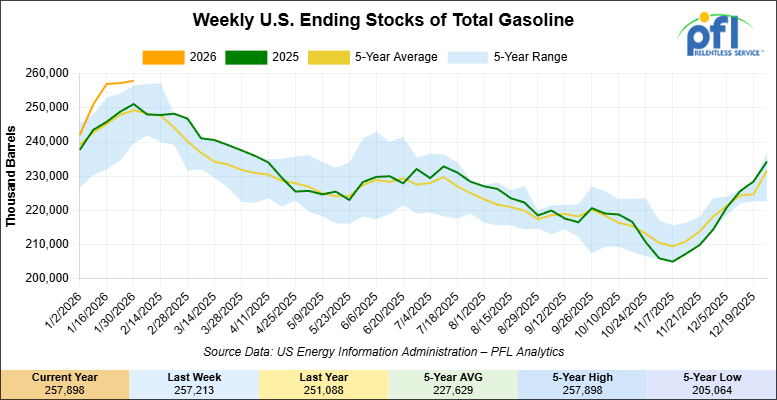
Distillate fuel inventories decreased by 5.6 million barrels week-over-week and are 2% below the five-year average for this time of year.
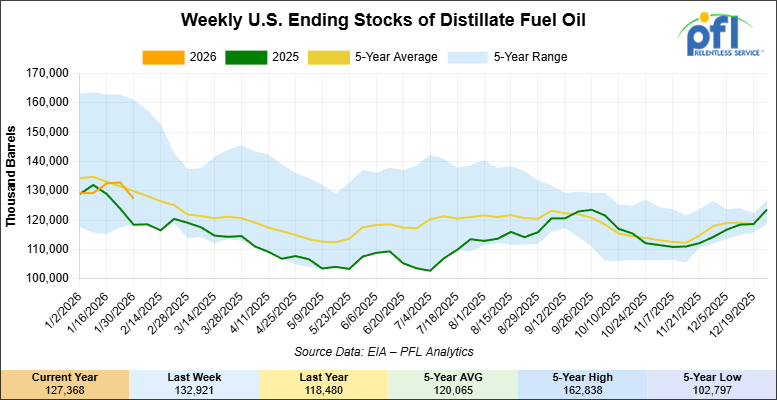
Propane/propylene inventories decreased 6.2 million barrels week-over-week and are 37% above the five-year average for this time of year.

Propane prices closed at 65.2 cents per gallon on Friday of last week, up 0.7 cents per gallon week-over-week, but down 24.3 cents year-over-year.

Overall, total commercial petroleum inventories decreased by 25.3 million barrels week-over-week, during the week ending January 30, 2026.
U.S. crude oil imports averaged 6.2 million barrels per day last week, an increase of 558,000 barrels per day week-over-week. Over the past four weeks, crude oil imports averaged 6.3 million barrels per day, 3.2% less than the same four-week period last year. Total motor gasoline imports (including both finished gasoline and gasoline blending components) averaged 394,000 barrels per day, and distillate fuel imports averaged 197,000 barrels per day during the week ending January 30, 2026.

U.S. crude oil exports averaged 4.047 million barrels per day during the week ending January 30, 2026, a decrease of 542,000 barrels per day week-over-week. Over the past four weeks, crude oil exports averaged 4.158 million barrels per day.

U.S. crude oil refinery inputs averaged 16 million barrels per day during the week ending January 30, 2026, which was 180,000 barrels per day less week-over-week.
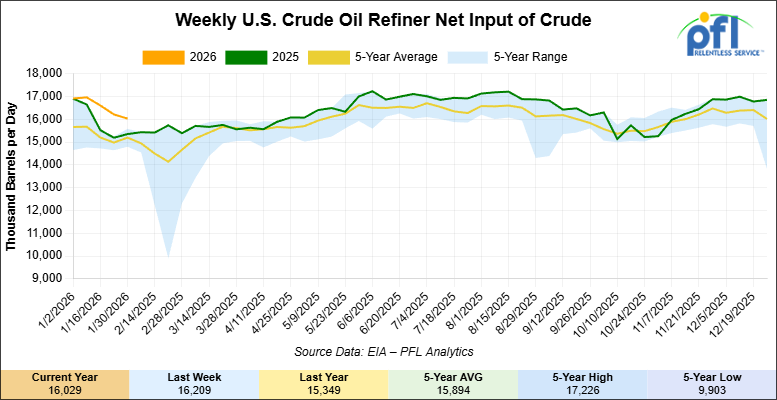
WTI is poised to open at $63.37, up 22 cents per barrel from Friday’s close.
North American Rail Traffic
Week Ending February 4, 2026:
Total North American weekly rail volumes were down (-16.10%) in week 6, compared with the same week last year. Total Carloads for the week ending February 4, 2026 were 278,308, down (-14.95%) compared with the same week in 2025, while weekly Intermodal volume was 293,079, down (-17.17%) year over year. 11 of the AAR’s 11 major traffic categories posted year-over-year decreases. The largest decrease came from Nonmetallic Minerals (-28.68%).
In the East, CSX’s total volumes were down (-9.99%), with the largest decrease coming from Motor Vehicles and Parts (-31.46%), while the largest increase came from Petroleum & Petroleum Products (+15.36%). NS’s total volumes were down (-21.64%), with the largest decrease coming from Motor Vehicles and Parts (-33.03%).
In the West, BNSF’s total volumes were down (-11.64%), with the largest increase coming from Grain (+11.81%), while the largest decrease came from Nonmetallic Minerals (-44.86%). UP’s total volumes were down (-14.86%), with the largest increase coming from Other (+11.46%), while the largest decrease came from Nonmetallic Minerals (-24.70%).
In Canada, CN’s total volumes were down (-18.93%), with the largest increase coming from Farm Products (+17.01%), while the largest decrease came from Intermodal Units (-35.93%). CPKCS’s total volumes were down (-35.14%), with the largest decrease coming from Forest Products (-75.24%).
Source Data: AAR – PFL Analytics
North American Rig Count Summary
Rig Count
North American rig count was up by +1 rig week-over-week. The US rig count was up by +5 rigs week-over-week, and down by -35 rigs year-over-year. The US currently has 551 active rigs. Canada’s rig count was down by -4 rigs week-over-week and down by -21 rigs year-over-year. Canada currently has 228 active rigs. Overall, year-over-year we are down by -56 rigs collectively.
International rig count was up by +14 rigs month-over-month and down by -20 rigs year-over-year. Internationally there are 1079 active rigs
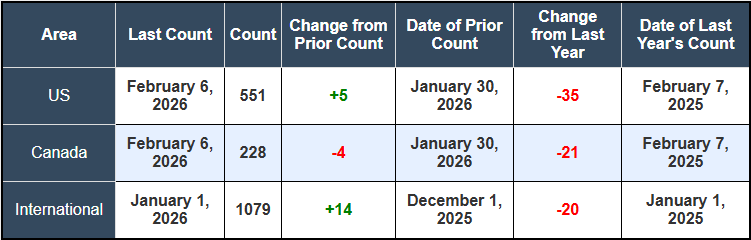
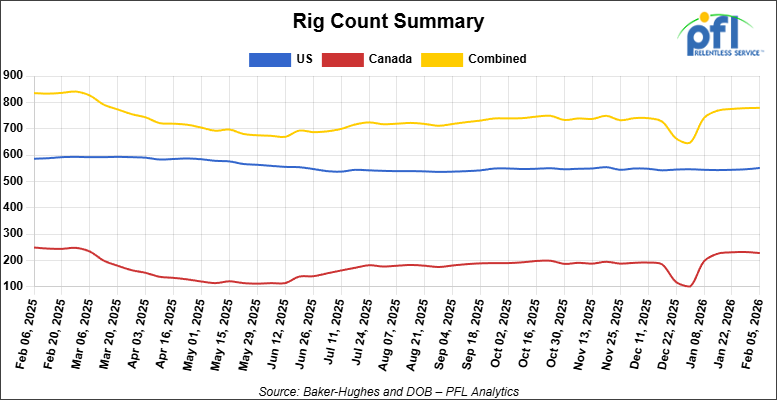
We are watching a few things out there for you:
We are Watching Petroleum Carloads
The four-week rolling average of petroleum carloads carried on the six largest North American railroads rose to 29,625 from 29,429 which was a increase of +196 rail cars week-over-week. Canadian volumes were mixed. CN’s shipments were higher by +4.0% week-over-week, CPKC’s volumes were lower by -12.0% week-over-week. U.S. shipments were mostly higher. The CSX had the largest percentage increase and was up by +8.0%. The NS was the sole decliner and was down by -4.0%.
We are Watching BP
United Steelworkers members at BP’s 440,000 barrels-per-day Whiting, Indiana refinery voted last week to reject the company’s proposed 28-day extension of their existing labor contract. The contract expired on February 1st. Union leaders have activated strike and lockout plans as a precaution but emphasized that no immediate work stoppage is planned. Both sides are continuing to negotiate.
Key points of contention reportedly include proposed job reductions, seniority provisions, layoff procedures, and wage terms. BP reemphasized its commitment to negotiating in good faith “to strengthen business competitiveness and create long-term sustainability.” Neither BP nor USW Local 7-1 has provided further public comment as negotiations continue.
Whiting is one of the largest refineries in the Midwest and a critical supplier to the region. Any prolonged disruption would tighten refined product supply across the Great Lakes and Upper Midwest, potentially boosting margins for competing refineries but straining logistics networks. For rail operators, a work stoppage could reduce crude inbound volumes but increase refined product movements as distributors scramble for supply from alternative sources.
Labor disputes at major refineries rarely escalate to full strikes, both sides understand the economic stakes, but the threat alone can create spot market volatility. PFL is keeping an eye on this one.
We are Watching Trans Mountain Pipeline
Trans Mountain applied to the Canada Energy Regulator last week to install drag reducing agent (DRA) equipment at 12 existing pump stations along its Line 1 and Line 2 pipelines. The $9 million project would add up to 90,000 barrels per day of throughput capacity – roughly 10 per cent above the system’s current 890,000 bpd—without building a single inch of new pipe. Construction is slated to begin in August with operations starting by January 2027.
DRA is a chemical additive that reduces friction inside the pipeline, a proven technology used globally in the industry. Each installation involves dropping in a pre-fabricated building roughly 3 meters by 12 meters inside the existing fence line at pump stations like Hinton, Rearguard, Blue River, and Black Pines. Work at each site takes about two weeks; the entire project wraps in eight months. No new land acquisition, no environmental disturbance beyond the fence line.
This is the first of three expansion projects Trans Mountain is pursuing. The second involves constructing additional pump stations to unlock another 360,000 bpd within the next five years. The third is dredging Vancouver’s Second Narrows to allow Aframax tankers to load to full capacity at Westridge, currently limited to 70%due to shallow navigation channels.
Folks, Alberta is going to hit a wall on pipeline capacity sooner than most think. Provincial crude production climbed 166,000 bpd last year to 4.1 million bpd and the oil sands aren’t done growing. Trans Mountain’s incremental expansions are the cheapest, fastest way to keep barrels flowing to tidewater before differentials blow out again.
Rail will stay relevant for stranded barrels and raw bitumen.
For some background, in the first 19 months of operations following the May 2024 completion of the Trans Mountain Expansion, an average of 60 per cent of the new oil export capacity served U.S. consumers, according to government documents obtained by Canada’s New Democratic Party. (a far left wing leading federal party). At least 214 million barrels of oil passed through the TMX expansion destined for the United States between May 2024 and November 2025.
For the rail sector, the numbers confirm what we’ve known all along: the U.S. Gulf Coast remains the primary destination for Canadian heavy crude. Trans Mountain’s spare capacity to Asia means pipeline competition for crude-by-rail remains intense in the near term. But if Alberta production continues to grow (it hit 4.1 million bpd in 2025) up 166,000 bpd year-over-year, and pipeline expansions lag, rail will be the marginal outlet once again. The fact that 60% of TMX volumes still flow to established U.S. refineries also confirms that pricing dynamics and refinery configurations continue to favor Gulf Coast markets over newer Asian buyers. Rail serves both markets: stranded barrels to U.S. refineries when pipelines are full, and opportunistic movements to Asia when premiums justify the economics.
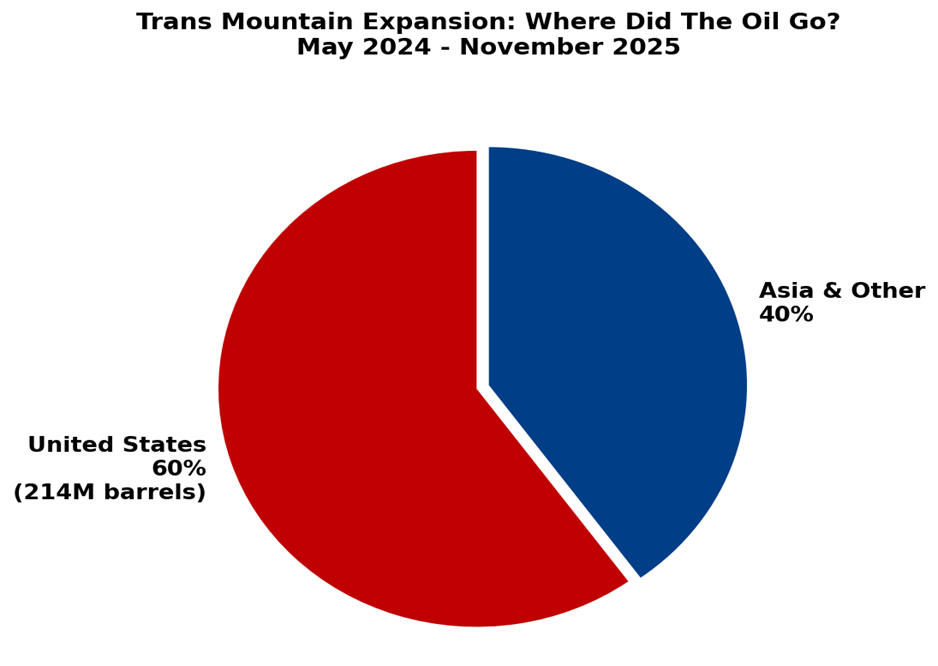
Source: Canada Development Investment Corporation – PFL Analytics
We are Watching the UP and NS
Forty-eight members of Congress sent a letter to the Surface Transportation Board on Wednesday, February 5, urging “rigorous and comprehensive review” of Union Pacific’s proposed $85 billion acquisition of Norfolk Southern. Representative Dusty Johnson (R-SD), who led the effort, made his position crystal clear: “I am inherently skeptical that consolidation in any market leads to better outcomes for customers.” The bipartisan letter warned that further rail consolidation could drive up prices for farmers, shippers, and consumers while degrading service quality across the network.
The political pressure comes as UP and NS face a critical deadline. The STB unanimously rejected their initial merger application on January 16th, ruling it incomplete because it lacked required market share projections and full copies of the merger agreement. The railroads have until Tuesday, February 17th to inform the STB whether they plan to refile. Any revised application must be submitted by June 22nd. Union Pacific CEO Jim Vena has called the rejection a “short-term blip” and insists the deal will still close in the first half of 2027 as originally planned.
This is the first major Class I merger to be evaluated under the STB’s tougher 2001 rules, which require that any combination enhance competition, not just maintain it. The proposed transaction would create the first true transcontinental railroad, linking the Pacific Coast directly to the Atlantic Seaboard and effectively ending the “Chicago Interchange” where freight changes hands between eastern and western carriers. The combined entity would control nearly half of U.S. rail freight, a level of concentration that has shipper groups, competing railroads, and now Congress is pushing back hard.
Opposition extends well beyond the 48 House members. Senate Minority Leader Chuck Schumer has condemned the merger as a “hostile takeover of America’s infrastructure” that threatens “dangerous consolidation and monopoly power.” All four competing Class I railroads—BNSF, CSX, Canadian National, and CPKC—have filed comments opposing the deal. Agricultural associations and other shipper groups have expressed alarm over potential rate increases and service degradation, particularly for captive shippers with no alternative rail access.
The stakes are enormous. Union Pacific’s merger agreement includes a $2.5 billion reverse termination fee payable to Norfolk Southern if the STB rejects the deal or imposes conditions too onerous to accept. For the railcar industry, approval would fundamentally reshape routing options, service commitments, and competitive dynamics across North America. The STB’s handling of this case will set the template for any future Class I consolidation—assuming there are any railroads left to merge. With Congress now formally weighing in and the February 17th deadline looming, the pressure on Union Pacific to deliver a complete application has never been higher.
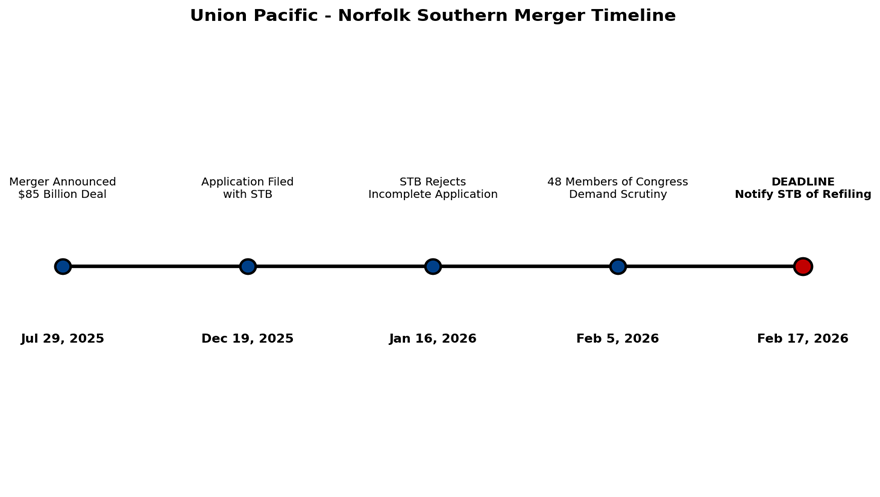
Source: Surface Transportation Board – PFL Analytics
We are Watching CPKC
January is typically one of the toughest months for grain movements. Colder temperatures increase diluent demand for oil sands bitumen, creating competition for rail capacity. Despite that, both CPKC and CN delivered record or near-record volumes. CN reported its second-best January on record at 2.72 million metric tonnes, just short of the 2.85 million tonne record from January 2020.
The railways are running flat out. CPKC noted that “all members of the grain supply chain continue operating at full capacity to maintain momentum”—industry speak for ‘we’re maxed out.’ CN credited operational adjustments and its 2025-2026 Winter Plan for keeping service levels up during extreme cold. Both carriers exceeded their supply chain capacity targets in their annual grain service plans.
Record winter grain movements signal tight capacity heading into spring when export programs intensify and domestic movements for livestock feed and processing ramp up. Add in Carney’s China trade deal—which slashed tariffs on Canadian canola from 84%to 15%and eliminated 100% of tariffs on canola meal – and you’ve got strong demand ahead. Canola is one of Western Canada’s largest rail export commodities, and tariff relief should support robust carload volumes to Pacific ports as China resumes large-scale purchases.
For hopper car lessors, this translates to sustained utilization and limited availability for spot movements. CPKC is investing C$500 million in high-capacity hopper cars and 100 new Tier 4 locomotives for the 2025-2026 grain year, planning to move up to 34 million metric tonnes based on current crop forecasts. CN is targeting 27-29.5 million metric tonnes. Over 90%of agricultural products in Canada move by rail—grain is the single largest commodity segment. When the system runs this hot, everyone with cars in the fleet benefits.
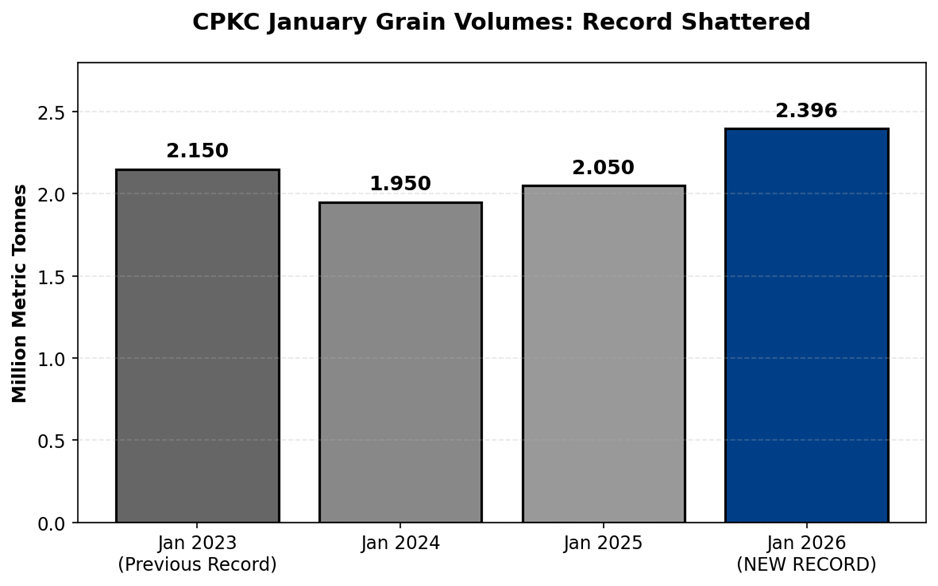
We are Watching CT Derailment Put Safety Back in the Headlines
Ten to fourteen freight cars derailed last Thursday morning in Mansfield, Connecticut near Route 32, with four cars carrying liquid propane ending up in the Willimantic River. The New England Central Railroad train was hauling 41 cars total when the rear cars detached around 9:20 a.m. Six of the derailed cars carried liquid propane; others were loaded with lumber, grain, and food-grade grease. One grease car leaked about 2,500 gallons, but it was contained. No propane leaks were detected as of midday Thursday.
Authorities issued a shelter-in-place order for residents within a half mile of the site. The cleanup is expected to take several days given the hard-to-reach location and frigid conditions. Cranes and specialized equipment began arriving Thursday evening. No injuries were reported, though the conductor and engineer were aboard when it happened.
Derailments remain the most common type of rail accident, accounting for 71% of all incidents reported to the FRA since 1975. The number has declined from a 1970s peak of 9,400 per year, but roughly 1,300 trains still derail annually in the United States. The FRA testified to Congress that there’s been “stagnation in railroads’ safety performance” and incidents like East Palestine in February 2023 are not isolated. Nearly 70% of derailments occur in urban areas, affecting more than 12,000 cities, towns, and villages along the nation’s 140,000-mile rail network.
We are Watching the U.S. Department of Treasury
The U.S. Department of Treasury and Internal Revenue Service released proposed regulations last Monday for the 45Z clean fuel production tax credit, as updated by the One Big Beautiful Bill in mid-2025. A 60-day public comment period is open, with a public hearing scheduled for May 28th.
The proposed regulations confirm that transportation fuel produced after December 31, 2025 must be exclusively derived from feedstock produced or grown in the United States, Mexico, or Canada to qualify for 45Z. The credit starts at 20 cents per gallon for non-aviation fuels and 35 cents per gallon for sustainable aviation fuel (SAF) for fuel produced on or before December 31, 2025. For facilities meeting prevailing wage and apprenticeship requirements, the credit jumps to $1 per gallon for non-aviation fuels and $1.75 per gallon for SAF.
The SAF premium was eliminated as of January 1, 2026, capping the credit at 20 cents per gallon/$1 per gallon for all eligible fuels depending on whether wage requirements are met. The credit adjusts annually for inflation; the IRS announced in July 2025 that the inflation adjustment factor for calendar year 2025 boosts the credit to 21 cents and $1.06 per gallon for non-SAF fuels and 37 cents and $1.86 per gallon for SAF. The 2026 inflation factor has not yet been announced.
The proposed regulations also confirm the 45Z credit cannot be stacked with the 45Q tax credit for carbon capture, utilization and storage (CCUS). Eligible fuel must have lifecycle greenhouse gas emissions of no greater than 50 kilograms of CO2e per mmBtu, and cannot be produced from a fuel for which a section 45Z credit is allowable (i.e., no double-dipping on renewable diesel made from ethanol that already claimed 45Z).
For renewable natural gas (RNG), the proposed guidance specifies that the 45Z credit should be claimed by the processor that produces the fuel, not the party that compresses the resulting RNG. Similarly, for liquid fuels, the credit goes to the fuel producer, not the fuel blender. Electricity is not considered an eligible transportation fuel for 45Z purposes.
The regulations eliminate indirect land use change (ILUC) from lifecycle greenhouse gas emission calculations for fuels produced after December 31, 2025, as directed by the One Big Beautiful Bill. This is significant for corn ethanol and soy-based biodiesel, which faced high ILUC penalties under previous frameworks. The proposal also indicates that lifecycle greenhouse gas emissions rates for fuel derived from animal manure may be less than zero starting in 2026, a potential boon for biogas projects tied to livestock operations.
The IRS is seeking stakeholder input on feedstock tracking to ensure only fuels derived from feedstocks produced or grown in the U.S., Canada, and Mexico qualify. The Treasury Department and IRS are considering substantiation and recordkeeping requirements for feedstocks imported from Canada and Mexico, including used cooking oil (UCO), and request comments on possible approaches that minimize taxpayer burden while remaining administrable.
These regulations solidify the economic incentives for domestic renewable fuel production using North American feedstocks. Expect continued strong demand for railcar movements of vegetable oils, animal fats, UCO, and ethanol to renewable diesel and SAF production facilities. The elimination of ILUC and the potential for sub-zero carbon intensity scores for manure-based biogas make certain feedstocks significantly more valuable, which could drive new production facilities and logistics routes. Rail will play a key role in moving these feedstocks and finished fuels, particularly for facilities without pipeline access.
We are Watching Key Economic Indicators
Purchasing Managers Index (PMI)
The Institute for Supply Management releases two PMI reports – one covering manufacturing and the other covering services. These reports are based on surveys of supply managers across the country and track changes in business activity. A reading above 50% on the index indicates expansion, while a reading below 50% signifies contraction, with a faster pace of change the farther the reading is from 50.
The Manufacturing PMI in January 2026 was 52.6%, up from 47.9% in December, moving back into expansion territory after an extended contraction and marking the highest reading since August 2022. On the Services PMI side, the most recent reading is 54.4% (December 2025), up from 52.6% in November, signaling continued expansion in the services sector at its strongest pace in over a year.
Lease Bids
- 30-50, 6000cf Steel Hopper located off of CSX or NS in East. For use in petcoke service. Period: 5 Years.
- 10, 2500CF Open Top Hopper located off of UP or BN in Texas. For use in aggregate service. Period: 5 years. Need Rapid Discharge Doors.
- 100, 21.9K 117J Tank located off of All Class 1s in Midwest. For use in CO2 service. Period: 6 months.
- 30-50, 30K 117J Tank located off of NS or CSX in Northeast. For use in C5 service. Period: 1 year.
- 20-50, 4000-5000 Covered Hopper located off of UP or BN in Houston. For use in Urea, Potash, Ammonium Sulfate service. Period: 6-12 Months.
Sales Bids
- 28, 3400CF Hopper Covered located off of UP BN in Texas. For use in Cement service. Cement Gates needed.
- 20, 17K Tank DOT111 located off of various class 1s in various locations. For use in corn syrup service.
- 120, Various Gondola Open-Top Aluminum Rotary located off of various class 1s in various locations. For use in Sulphur service. Built 2004 or later.
- 30, 29K Tank DOT111 located off of various class 1s in Chicago. For use in Veg Oil service.
Lease Offers
- 100, 30K CPC1232 Tanks located off of UP or BN in Texas. Last used in Diesel.
- 100, 30K DOT117J Tanks located off of UP or BN in Texas. Last used in Gasoline.
- 100, 29K DOT117J Tanks located off of UP or BN in Texas. Last used in Gasoline. Coiled and Insulated.
- 21, 6351 Covered Hopper located off of CN in Wisconsin. Last used in DDG. Available until February 2027.
- 29, 6500 Covered Hopper located off of CN in Wisconsin. Last used in DDG. Available until February 2027.
- 50, 20K DOT117J Tank located off of All Class 1s in Moving. Last used in Styrene.
- 29, 25.5K DOT117J Tank located off of UP or BN in Texas. Cars are currently clean. Cars are currently clean.
- 90, 30K DOT117J Tank located off of UP or BN in Corpus Christie. Last used in Diesel.
- 200, 340W DOT 112J Tank located off of All Class 1s in Multiple Locations. Last used in Propane and Butane. Cars are currently clean.
- 15, 6200CF Covered Hopper located off of All Class 1s in Wisconsin. Last used in Plastic. Cars are currently clean.
- 30, 6500CF Covered Hopper located off of All Class 1s in Wisconsin. Last used in Plastic. Cars are currently clean.
Sales Offers
- 50, 31.8K CPC1232 Tanks located off of UP or BN in TX. Last used in Multiple. Requal Due in 2025.
- 100, 4600CF Open Top Hoppers located off of BN or CSX in Southeast. Last used in Coal.
- 35, 3400CF Covered Hoppers located off of UP or BN in Midwest. Last used in Sand.
- 25, 30K 117J Tanks located off of CSX in Jackson, TN. Last used in Fuels. Newly Requalified.
Call PFL today to discuss your needs and our availability and market reach. Whether you are looking to lease cars, lease out cars, buy cars, or sell cars call PFL today at 239-390-2885
Live Railcar Markets
| CAT | Type | Capacity | GRL | QTY | LOC | Class | Prev. Use | Offer | Note |
|---|
PFL will be at the Following Conferences
- Where: La Quinta, CA
- Attending: David Cohen (954-729-4774)
- Conference Website
- Where: Hyatt Regency Dallas in Dallas, TX
- Attending:Curtis Chandler (239.405.3365), David Cohen (954-729-4774), Brian Baker (239.297.4519), Cyndi Popov(403) 402-5043
- Conference Website
The post PFL Railcar Report 2-9-2026 appeared first on PFL Petroleum Services LTD.
]]>The post PFL Railcar Report 2-2-2026 appeared first on PFL Petroleum Services LTD.
]]>Jobs Update
- Initial jobless claims seasonally adjusted for the week ending January 24, 2026 came in at 209,000, versus the adjusted number of 210,000 people from the week prior, down 1,000 people week over week.
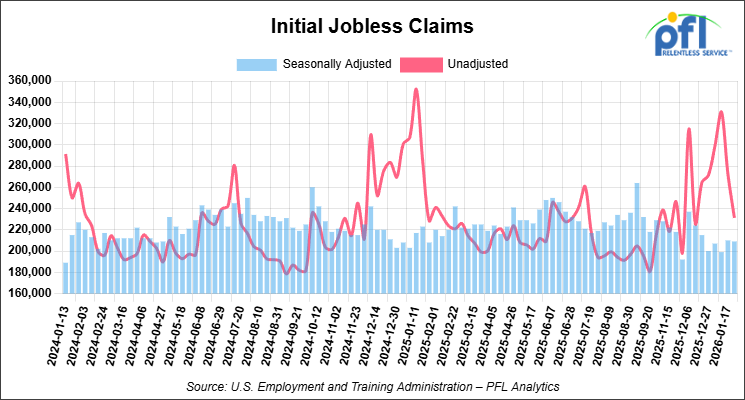
- Continuing jobless claims came in at 1,865,000, versus the adjusted number of 1,875,000 people from the week prior, down 10,000 week-over-week.
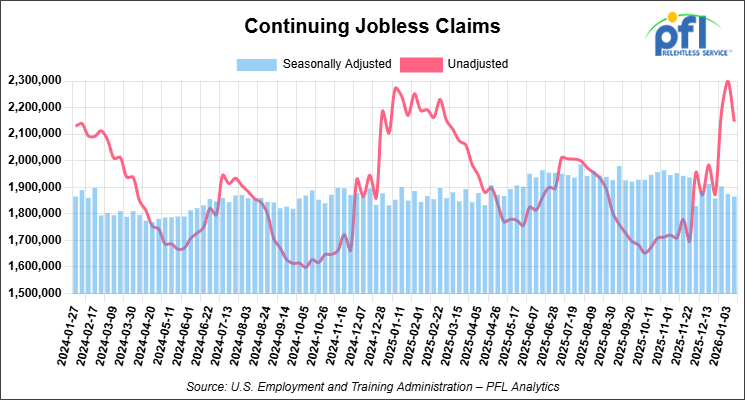
Stocks closed lower on Friday of last week and mixed week-over-week
The DOW closed lower on Friday of last week, down -179.09 points (-0.36%), closing out the week at 48,892.47, down -206.24 points week-over-week. The S&P 500 closed lower on Friday of last week, down -29.98 points (-0.43%), and closed out the week at 6,939.03, up 23.42 points week-over-week. The NASDAQ closed lower on Friday of last week, down -223.30 points (-0.94%), and closed out the week at 23,461.82, down -39.42 points week-over-week.
In overnight trading, DOW futures traded lower and are expected to open at 48,951 this morning down -57 points.
Crude oil closed lower on Friday of last week and higher week-over-week
West Texas Intermediate (WTI) crude closed down -0.21 per barrel (-0.32%), to close at $65.21 on Friday of last week, but up $4.14 week-over-week. Brent crude closed down -0.02 per barrel (-0.03%), to close at $70.69, but up $4.81 week-over-week.
One Exchange WCS (Western Canadian Select) for March delivery settled on Friday of last week at US$14.50 below the WTI-CMA (West Texas Intermediate – Calendar Month Average). The implied value was US$50.62 per barrel.
U.S. commercial crude oil inventories (excluding those in the Strategic Petroleum Reserve) decreased by 2.3 million barrels week-over-week. At 423.8 million barrels, U.S. crude oil inventories are 3% below the five-year average for this time of year.

Total motor gasoline inventories increased by 200,000 barrels week-over-week and are 5% above the five-year average for this time of year.
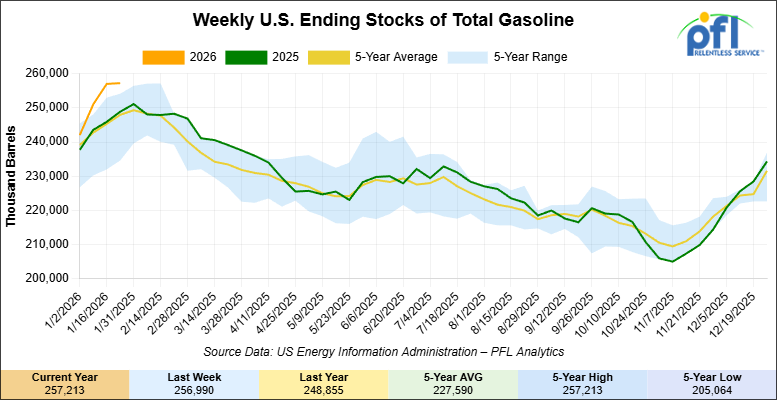
Distillate fuel inventories increased by 300,000 barrels week-over-week and are 1% above the five-year average for this time of year.
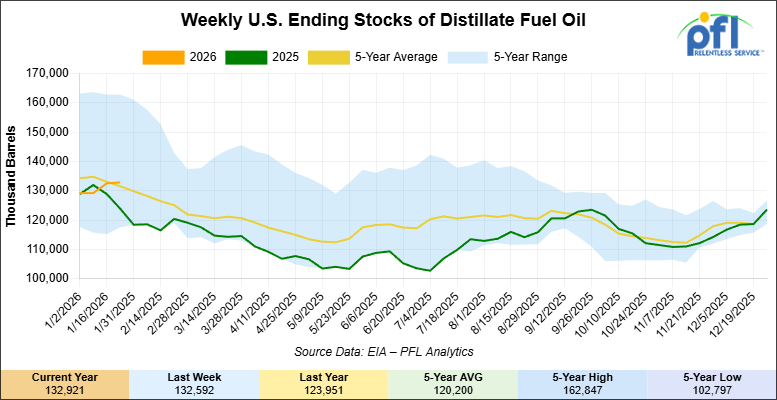
Propane/propylene inventories decreased 4.7 million barrels week-over-week and are 41% above the five-year average for this time of year.

Propane prices closed at 64.5 cents per gallon on Friday of last week, up 4.9 cents per gallon week-over-week, but down 27 cents year-over-year.

Overall, total commercial petroleum inventories decreased by 6.8 million barrels week-over-week, during the week ending January 23, 2026.
U.S. crude oil imports averaged 5.6 million barrels per day during the week ending January 23, 2026, a decrease of 804,000 barrels per day week-over-week. Over the past four weeks, crude oil imports averaged 6.4 million barrels per day, 0.9% less than the same four-week period last year. Total motor gasoline imports (including both finished gasoline and gasoline blending components) averaged 364,000 barrels per day, and distillate fuel imports averaged 253,000 barrels per day during the week ending January 23, 2026.

U.S. crude oil exports averaged 4.589 million barrels per day during the week ending January 23, 2026, an increase of 901,000 barrels per day week-over-week. Over the past four weeks, crude oil exports averaged 4.212 million barrels per day.

U.S. crude oil refinery inputs averaged 16.2 million barrels per day during the week ending January 23, 2026, which was 395,000 barrels per day less week-over-week.

WTI is poised to open at $61.74, down $3.47 per barrel from Friday’s close.
North American Rail Traffic
Week Ending January 28, 2026:
Total North American weekly rail volumes were up (+2.61%) in week 5, compared with the same week last year. Total Carloads for the week ending January 28, 2026 were 309,403, up (+9.05%) compared with the same week in 2024, while weekly Intermodal volume was 320,364, down (-2.93%) year over year. 4 of the AAR’s 11 major traffic categories posted year-over-year decreases. The largest decrease came from Forest Products (-16.26%), while the largest increase was Nonmetallic Minerals (+27.77%).
In the East, CSX’s total volumes were up (+11.40%), with the largest decrease coming from Metallic Ores and Metals (-11.06%), while the largest increase came from Nonmetallic Minerals (+29.74%). NS’s total volumes were up (+6.19%), with the largest increase coming from Nonmetallic Minerals (+32.21%), while the largest decrease came from Grain (-6.33%).
In the West, BNSF’s total volumes were up (+2.23%), with the largest increase coming from Nonmetallic Minerals (+35.61%), while the largest decrease came from Forest Products (-9.39%). UP’s total volumes were up (+1.39%), with the largest increase coming from Grain (+64.17%), while the largest decrease came from Intermodal Units (-13.72%).
In Canada, CN’s total volumes were down (-3.08%), with the largest increase coming from Grain (+65.86%), while the largest decrease came from Motor Vehicles and Parts (-18.80%). CPKCS’s total volumes were down (-21.47%), with the largest increase coming from Coal (+21.51%), while the largest decrease came from Forest Products (-64.86%).
Source Data: AAR – PFL Analytics
North American Rig Count Summary
Rig Count
North American rig count was up by +3 rigs week-over-week. The U.S. rig count was up by +2 rigs week-over-week, but down by -36 rigs year-over-year. The U.S. currently has 546 active rigs. Canada’s rig count was up by +1 rig week-over-week, but down by -26 rigs year-over-year. Canada currently has 232 active rigs. Overall, year-over-year we are down by -62 rigs collectively.

We are watching a few things out there for you:
Happy Groundhog Day Folks
Well expect the record-setting cold Philadelphia has experienced in recent days to continue for the next six weeks, at least according to Punxsutawney Phil. The weather-predicting groundhog saw his shadow Monday outside his hole at Gobbler’s Knob in Punxsutawney, Pa. If you believe such things, that means the entire country – including our snow-covered section of the Northeast – can expect below-average temperatures for the next six weeks
We are Watching Petroleum Carloads
The four-week rolling average of petroleum carloads carried on the six largest North American railroads rose to 29,429 from 28,558, which was a increase of +871 rail cars week-over-week. Canadian volumes were mixed. CPKC’s shipments were higher by +10.0% week-over-week, CN’s volumes were lower by -2.0% week-over-week. U.S. shipments were also mixed. The NS had the largest percentage increase and was up by +3.0%. The CSX had the largest percentage decrease and was down by -6.0%.
We are Watching Canadian Crude Oil Exports by Rail
The Canadian Energy regulator reported on January 26, 2026, that 85,055 barrels were exported during the month of November 2026 up from 78,117 barrels in October of 2025, an increase of 6,938 barrels per day month over month.
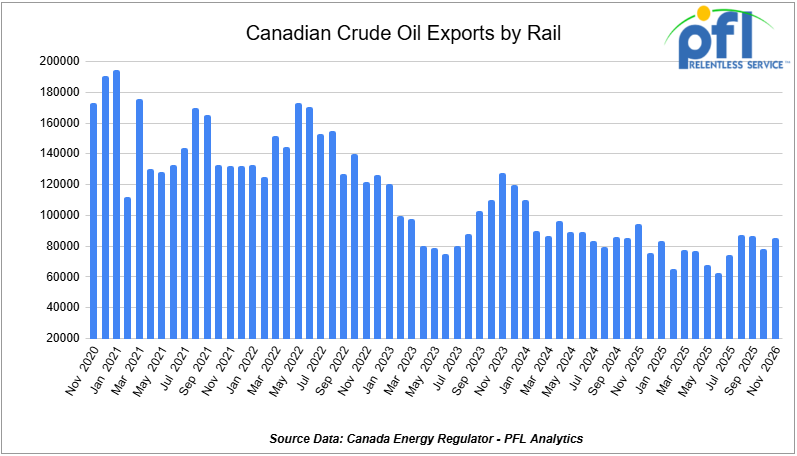
Crude by rail will always be necessary out of Canada for stranded oil not connected by pipelines. Raw bitumen, which is shipped as a non-haz product and is not able to flow in pipelines, is competitive with pipeline tolls and is a growing market to keep an eye on, particularly in light of Strathcona and Gibson announcing new projects. Other factors would be existing long-term contractual commitments and basis – we really need to see basis WTI-CMA (West Texas Intermediate – Calendar Month Average) blowout to -18 per barrel for sustained periods of time to make economic sense. Current rail rates from Alberta to the U.S. Gulf Coast have averaged $15.36 per barrel, making rail competitive whenever WCS-WTI spreads exceed $18 per barrel, including quality adjustments.
We Continue to Watch Oil and Gas
In the first month of 2026, the oil and gas industry has been shaped by a mix of strong earnings, geopolitical maneuvers, supply shifts, and strategic portfolio realignments. Despite the backdrop of global oversupply, Chevron and ExxonMobil are delivering results that topped expectations. They continued to deliver record production volumes — particularly in the Permian Basin and other key U.S. plays — even as profits softened compared with earlier peaks and refining margins fluctuated with market conditions. Their performance underscores how major integrated producers are navigating tight pricing environments and cost pressures.
At the same time, benchmark crude oil and natural gas prices climbed over recent weeks, influenced by weather-related production disruptions in the U.S. and geopolitical risk perceptions. Winter cold snaps in key producing regions temporarily constrained output, tightening balances and lifting prices, while concerns over broader supply reliability continued to support energy markets. These price movements reflect the ongoing tension between robust inventories and episodic supply constraints that can trigger rallies in both oil and gas benchmarks.
The repositioning of Venezuelan crude flows is rapidly reshaping international crude markets. Trading houses such as Trafigura have already sold their first cargoes of Venezuelan heavy crude under newly negotiated supply arrangements, with shipments destined for European refiners capable of processing viscous sour grades. Vitol is likewise moving Venezuelan cargos to Italy and to refiners in the U.S. Gulf Coast and Asia, capitalizing on authorized trade channels opening up after the U.S. eased longstanding sanctions on Venezuelan oil exports. These early shipments — part of a larger 50 million-barrel supply agreement brokered between Caracas and Washington — mark some of the first conventional crude flows out of Venezuela in years and signal how mainstream market forces are re-entering a once-frozen trade lane.
One company making headlines as of late is Valero. Valero’s recent announcement that it has engaged with three U.S. – authorized sellers of Venezuelan crude underscores a shift in heavy oil supply for Gulf Coast refiners. Valero expects these grades to make up a “pretty large part” of its heavy crude intake in the coming months. This shift could have real implications for rail markets, possibly displacing Canadian barrels that would normally be destined for the U.S. Gulf Coast – forcing those barrels to Eastern U.S. refineries or to be exported to Asian markets.
Canada is actively pivoting export strategies toward Asia, particularly China, as part of a broader effort to reduce its near-exclusive dependence on U.S. energy demand. Record production levels from Alberta’s oil sands, enabled by expanded pipeline capacity such as the Trans Mountain Extension, have boosted export volumes and helped Canadian producers diversify into longer-haul markets. However, challenges remain, including pipeline bottlenecks re-emerging under a global crude glut and continued debate over energy infrastructure expansions amid environmental and indigenous policy hurdles.
Alberta’s Premier Danielle Smith was speaking at a press conference on Friday of last week with Canada’s 13 Premiers (similar to a Governor here in the U.S.) and left wing Prime Minister Mark Carney, following two days of meetings in Ottawa to discuss trade diversification and other national issues. She said Kitimat will not be the terminus for a proposed Alberta-to–West Coast oil pipeline, citing overly complex marine navigation. Smith said a proposal to expand Enbridge’s mainline was “interesting” to ship crude by rail to the East Coast to access more European markets. She said more American routes “….kind of misses the point of the exercise. I suppose we could sell more to the United States, but why we’re all here is we’re trying to find a way to trade with each other (Provinces of Canada trading with other Provinces of Canada – believe it or not folks this does not happen very often!) and help each other and find new markets.” There was also continued talk of expanding the Port of Churchill, or a route through the Northwest Territories. She said Alberta aims to have its proposal ready by June and expects private-sector interest once approved.
We Continue to Watch Left Wing Canadian Prime Minister Carney
As our readers are aware, PFL has offices in Canada and does a bunch of work up in Canada and many ask what is wrong with Canada? What are they thinking? We will try and explain below the best we can:
Canada is living through one of history’s great economic contradictions. Commodity prices remain elevated across energy, agriculture, and critical minerals—the exact resources Canada holds in abundance. Oil is trading above $60 per barrel, natural gas recently spiked above $6 per MMBtu during cold snaps, potash prices remain firm on global food security concerns, and lithium, cobalt, and rare earth minerals command premiums as the world scrambles to secure battery supply chains.
Canada has it all! Canada ranks third globally in proven oil reserves, holds vast natural gas deposits, dominates global potash production, and possesses significant uranium and critical mineral resources that Western nations desperately need. Yet, despite this resource wealth and elevated global prices, ordinary Canadians are getting materially poorer. Housing costs have doubled in a decade, grocery prices have climbed 30% since 2020, and after-tax incomes are stagnant or declining in real terms for most households. In his first weeks as Prime Minister, Mark Carney announced a “Canada Groceries and Essentials Benefit”—providing families of four up to $1,890 in direct payments to cope with affordability pressures. The rebate is essentially an admission of policy failure: a resource-rich nation during a commodity boom requiring grocery subsidies for its middle class. What a joke!
The irony of Carney’s government is that it has made substantial course corrections on climate policy while leaving the structural impediments to resource development largely intact. Carney scrapped the consumer carbon tax on his first day in office – March 14, 2025 – after spending years as UN Special Envoy for Climate Action championing carbon pricing as essential to emissions reduction. Eight months later, in November 2025, he signed a memorandum of understanding with Alberta Premier Danielle Smith that scrapped the oil and gas sector emissions cap, suspended clean electricity regulations, and committed to adjusting the Oil Tanker Moratorium Act to facilitate a new Pacific pipeline. Environment Minister Steven Guilbeault resigned immediately after the deal was announced. Carney – the former central banker who wrote in his 2021 book that “meaningful carbon prices are a cornerstone of any effective policy framework”– eliminated both the consumer carbon tax and the sectoral emissions cap within his first year in office. The policy reversals were politically necessary; the consumer carbon tax had become toxic with voters amid inflation, and the emissions cap faced unified opposition from Alberta, Saskatchewan, and the oil industry. But, the flip-flops reveal a government reacting to political pressure rather than executing a coherent economic growth strategy.
Eliminating the carbon tax and emissions cap removes some costs and regulatory uncertainty, but these changes do not address the core problem: Canada’s regulatory and approval processes remain hostile to resource development, investment capital continues fleeing to more competitive jurisdictions, and the tax burden on high earners and businesses remains among the highest in the developed world. Major resource projects still take 10-15 years to permit and develop in Canada versus 3-5 years in Australia. LNG export terminals that could supply European and Asian markets face multi-year environmental reviews while U.S. Gulf Coast LNG capacity has grown from near-zero in 2015 to over 100 million tons per year today. Critical mineral projects essential for battery supply chains languish in approval processes while similar projects in Nevada or Western Australia move to production. The Liberals imposed emissions caps on the oil and gas sector in 2021, published draft regulations in 2024, then scrapped the entire framework in 2025 – creating three years of investment uncertainty that deterred capital deployment regardless of the ultimate policy outcome. Carney’s government has signaled openness to a new Pacific pipeline, approved an LNG expansion in British Columbia, and committed to streamlining approvals, but concrete action remains limited and timelines remain vague.
Meanwhile, federal program spending has increased from $250 billion annually in 2015 to over $500 billion today, while GDP growth has badly lagged population growth, producing declining per-capita income. Federal debt has climbed from $600 billion in 2015 to over $1.3 trillion, producing annual debt servicing costs exceeding $50 billion – more than Canada spends on national defense. The Liberal response under both Trudeau and Carney has been to increase taxes on high earners and corporations while expanding social programs, subsidies, and transfer payments. Combined federal-provincial top marginal income tax rates now exceed 53 percent in Ontario, Quebec, and British Columbia – among the highest in the developed world and materially above competing U.S. states. For professionals, entrepreneurs, and skilled workers, the after-tax economic proposition of staying in Canada versus relocating to the United States has deteriorated sharply. Doctors, engineers, tech workers, and finance professionals are leaving for higher after-tax incomes, lower costs of living, and jurisdictions that treat wealth creation as desirable rather than problematic.
This exodus mirrors California’s experience, where progressive tax policies and soaring costs drove unprecedented outmigration of high earners and businesses to Texas, Florida, Arizona, and Nevada between 2020 and 2025. It is still happening today with Wells Fargo announcing last week that they are moving their corporate offices from California to Florida. The migrants were disproportionately high earners—exactly the tax base California needs to fund its expansive social programs. Canada faces the same dynamic. Statistics Canada data shows net emigration of Canadian residents to the United States has turned sharply negative, with tens of thousands more Canadians moving south than Americans moving north annually. These are working-age professionals and entrepreneurs concluding that Canada’s tax burden, cost of living, and economic opportunities no longer justify staying. The Liberal government’s solution—grocery rebates, direct payments, and expanded subsidies—accelerates the problem by increasing the tax burden on those who remain while doing nothing to address the structural productivity and competitiveness issues driving the exodus. Redistribution requires wealth creation; Canada is attempting redistribution while constraining the sectors that create wealth.
What Canada needs is a fundamental reorientation toward economic growth, resource development, and productivity improvement.
First, embrace resource extraction and export as a strategic economic priority. Approving LNG export terminals on the West Coast would position Canada to supply Asian and European markets currently served by Qatar, Australia, and the United States. Canadian natural gas is among the lowest-emission in the world due to strict regulations and modern production techniques, yet Canada exports virtually none in liquefied form while U.S. Gulf Coast LNG capacity has exploded. Critical minerals—lithium, cobalt, nickel, rare earths—are essential for electric vehicle batteries, defense systems, and renewable energy infrastructure. Western nations have identified supply chain vulnerability to China as a national security issue and are willing to pay premiums for North American supply. Yet Canadian critical mineral projects take 10-15 years to permit versus 3-5 years in Australia. Streamlining approvals to 2-3 years for major projects would unlock tens of billions in private investment without sacrificing environmental review. At the same time, why not make it a year or even months? Canada has been studying the environment for years!
Second, rebuild the tax system to retain talent and attract investment. Reducing top marginal rates to 45 percent combined federal-provincial would slow the brain drain and signal that Canada values wealth creators. Increasing capital cost allowances, eliminating interprovincial trade barriers, and reducing regulatory compliance costs would improve the business investment climate. These are competitive necessities for a country hemorrhaging talent and capital to more favorable jurisdictions.
Third, invest in infrastructure that enables resource development rather than constraining it. Pipeline capacity determines whether Canadian crude sells at global prices or persistent discounts. Rail capacity determines whether grain and potash reach export markets during demand windows or sit in storage. Port terminals determine whether critical minerals move efficiently to buyers or queue for weeks. LNG export terminals determine whether Canadian gas reaches premium Asian markets or gets sold at domestic spot prices. The Liberal approach created under 10 years of a Trudeau government – blocked pipelines, underfund rail, deferred port expansions, slowed LNG approvals – created bottlenecks preventing Canada from capturing full value from its resource base. Carney said he has shifted toward infrastructure support, but concrete action remains limited, we have seen nothing but talk. A government serious about prosperity would approve projects, expedite permitting, and work with provinces and industry to remove barriers.
Fourth, recognize that fiscal sustainability requires economic growth, not borrowing and redistribution. Transfer payments, social programs, and debt servicing consume increasing shares of federal revenue while the tax base erodes through emigration and underinvestment. Growing the economy through resource development, infrastructure investment, and productivity improvements makes social programs affordable; borrowing to fund rebates while strangling wealth-creating sectors leads to stagnation, higher taxes, or both.
If Canada pursues these policies, rail car market implications are substantial. Increased oil sands production requires unit trains of diluent inbound and crude or dilbit outbound when pipeline capacity fills. LNG facility construction and operation generate specialty carloads of equipment, materials, and chemicals. Critical mineral mines require inbound reagents and outbound concentrates. Potash production growth increases covered hopper demand for movements to Vancouver and export terminals. Grain volumes rise when farmers respond to strong global prices and have adequate logistics to move product. Forest products, steel, manufactured goods, and intermodal freight all benefit from a stronger overall economy with higher investment and employment. Conversely, if Canada continues muddling through – removing some regulatory barriers while maintaining others, cutting some taxes while raising others, approving some projects while deferring others – the structural demand environment for rail transportation remains weak. Crude-by-rail becomes a niche market managing pipeline constraints rather than a growth opportunity. Grain movements stay limited by production uncertainty. Specialty carloads tied to mining, manufacturing, and construction face headwinds as projects migrate to more competitive jurisdictions or do not proceed.
Left wing Carney’s November deal with Alberta, his March elimination of the consumer carbon tax, and his January grocery rebate announcement encapsulate the challenge. The Prime Minister has abandoned climate policies he spent a decade championing—not because the science changed, but because the politics did. He travels abroad securing tariff reductions and lecturing global elites, then returns home to announce payments helping Canadians afford food. The policy reversals suggest responsiveness to political reality, but they do not constitute an economic growth strategy. Canada does not need grocery rebates, trade deals with China, or speeches about sovereignty—it needs policies that enable the country to develop its resources, attract investment, retain talent, and build infrastructure required to capitalize on the most favorable commodity environment in decades. Until that happens, Canadians will grow poorer despite living in one of the most resource-rich nations on earth, and the rail car industry will watch potential demand growth migrate to the United States while Canadian volumes stagnate. The opportunity is generational; the risk of squandering it through incoherence and half-measures is real. Left Wing Carney needs a wake-up call, or Canada needs a real leader. Stay tuned to PFL we are always watching this one!
We are Watching Private Equity
Adding a strategic twist to the industry landscape, U.S. private equity giant The Carlyle Group agreed to buy most of Russia’s Lukoil’s international assets, a sweeping portfolio spanning oilfields, refineries, and downstream holdings across Europe, the Middle East, Africa, and Central Asia. Lukoil, Russia’s second-largest oil producer, has been compelled to divest these assets under mounting Western sanctions aimed at curtailing Russian hydrocarbon revenues tied to the Ukraine conflict. The sale — still subject to U.S. Treasury Office of Foreign Assets Control (OFAC) approval and due diligence — would mark a rare transfer of major global energy assets to Western capital markets, with implications for ownership patterns, refinery feedstock control, and energy security across multiple regions.
We are watching Chemical Companies
Dow’s announcement that it will cut roughly 4,500–5,000 jobs globally is being described as part of a broader effort to reduce costs, simplify operations, and rely more heavily on automation and AI. The move follows a tough earnings year and is expected to include meaningful impacts at Gulf Coast operations, especially the Freeport area.
While the announcement isn’t about rail directly, it fits a pattern that rail-shipping manufacturers, especially in chemicals, have been moving toward for some time.
When companies reduce headcount and push for leaner operations, plants tend to run with less buffer. Production is scheduled more tightly, staffing is thinner, and there’s less room for delays or inefficiencies.
For rail, this often shows up as:
● Shipments that are less steady and more start-and-stop;
● Cars being held while production or sales plans are adjusted;
● More repositioning of equipment as plans change.
Volumes don’t necessarily fall off a cliff, but the flow becomes less predictable.
Gulf Coast Impacts:
Dow’s Gulf Coast footprint is heavily tied to rail and export activity. When large sites in that region adjust staffing or operating models, the effects usually show up indirectly, through changes in timing, staging, and how long railcars sit between moves.
These kinds of shifts are common during restructurings. Rail becomes the place where mismatches between production and demand are worked through, often quietly and over weeks or months rather than all at once.
Automation:
Dow has pointed to AI and automation as tools to improve planning and efficiency. While better planning can help, it also tends to tighten the system. When everything is optimized closely, there’s less tolerance for disruption, whether that’s weather, service issues, or sudden demand changes.
In those environments, rail networks are often asked to adapt quickly, even if overall shipment levels don’t change much.
A Familiar Industry Story:
Dow isn’t alone. Across industrial and chemical manufacturing, companies are cutting costs, simplifying operations, and trying to do more with less. These moves don’t always make headlines in rail data, but they do influence how rail assets are used day-to-day.
The result is a market where rail isn’t just moving product from A to B, it’s helping manage timing, pauses, and adjustments when plans don’t line up perfectly.
That dynamic continues to shape rail activity across the chemical sector, and Dow’s announcement is another example of it playing out in real time.
We Are Watching Key Economic Indicators
Producer Price Index
In December 2025, the Producer Price Index (PPI) for final demand rose 0.5% month over month, accelerating from the 0.2% increase in November and indicating firmer upstream inflation pressures to close the year. Core PPI (final demand less foods, energy, and trade services) increased 0.4% month over month, matching November’s pace. The monthly increase was driven primarily by services, which rose 0.7%, while goods were unchanged (0.0%). Within goods, food prices declined 0.3% and energy prices fell 1.4%, while goods less food and energy increased 0.4%. Within services, trade margins rose 1.7%, transportation and warehousing increased 0.5%, and services excluding trade, transportation, and warehousing rose 0.3%.
In December 2025, the Consumer Price Index (CPI) increased 0.3% month over month, matching November’s gain, and was up 2.7% year over year, easing from the prior month. Core CPI (all items less food and energy) rose 0.2% month over month and was up 2.6% year over year. Shelter remained the largest contributor, increasing 0.4% for the month. Food prices rose 0.3%, with food at home up 0.4% and food away from home up 0.2%. Energy prices increased 0.4%, led by a 1.1% rise in gasoline prices.
Consumer Confidence
The Index of Consumer Sentiment from the University of Michigan increased from 53.3 in December to 54.0 in January.
The Conference Board Consumer Confidence Index decreased from 94.2 in December to 84.5 in January.
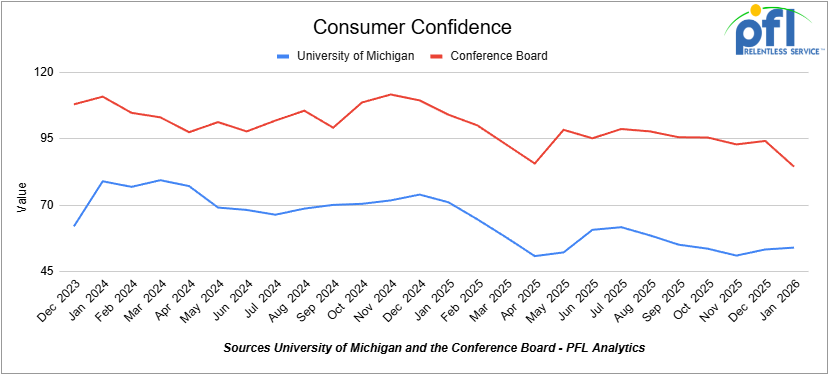
Lease Bids
- 30-50, 6000cf Steel Hopper located off of CSX or NS in East. For use in petcoke service. Period: 5 Years.
- 10, 2500CF Open Top Hopper located off of UP or BN in Texas. For use in aggregate service. Period: 5 years. Need Rapid Discharge Doors.
- 100, 21.9K 117J Tank located off of All Class 1s in Midwest. For use in CO2 service. Period: 6 months.
- 30-50, 30K 117J Tank located off of NS or CSX in Northeast. For use in C5 service. Period: 1 year.
- 60, 33K 340W Tank located off of BNSF in UT/AZ. For use in Propane service. Period: Trip Lease.
Sales Bids
- 28, 3400CF Hopper Covered located off of UP BN in Texas. For use in Cement service. Cement Gates needed.
- 20, 17K Tank DOT111 located off of various class 1s in various locations. For use in corn syrup service.
- 120, Various Gondola Open-Top Aluminum Rotary located off of various class 1s in various locations. For use in Sulphur service. Built 2004 or later.
- 30, 29K Tank DOT111 located off of various class 1s in Chicago. For use in Veg Oil service.
Lease Offers
- 100, 30K CPC1232 Tanks located off of UP or BN in Texas. Last used in Diesel.
- 100, 30K DOT117J Tanks located off of UP or BN in Texas. Last used in Gasoline.
- 100, 29K DOT117J Tanks located off of UP or BN in Texas. Last used in Gasoline. Coiled and Insulated.
- 36, 6351 Covered Hopper located off of CN in Wisconsin. Last used in Grain. through 2/27.
- 29, 6580 Covered Hopper located off of CN in Wisconsin. Last used in Grain. through 2/26.
- 18, 6580 Covered Hopper located off of CN in Wisconsin. Last used in Grain. through 2/27.
- 9, 5400 Covered Hopper located off of CN in Wisconsin. Last used in Grain. through 2/27.
- 21, 6351 Covered Hopper located off of CN in Wisconsin. Last used in DDG. Available until February 2027.
- 29, 6500 Covered Hopper located off of CN in Wisconsin. Last used in DDG. Available until February 2027.
- 50, 5380 Covered Hopper located off of UP or BN in Houston. Last used in Fertilizer. Cars are currently clean. Available until February.
- 50, 20K DOT117J Tank located off of All Class 1s in Moving. Last used in Styrene.
- 29, 25.5K DOT117J Tank located off of UP or BN in Texas. Cars are currently clean. Cars are currently clean.
- 90, 30K DOT117J Tank located off of UP or BN in Corpus Christie. Last used in Diesel.
Sales Offers
- 21, 50′ Boxcar Plate Cs located off of various class 1s in NM. End of Life.
- 3, 50′ Boxcar Plate Cs located off of various class 1s in multiple locations. End of Life.
- 27, 50′ Boxcar Plate Cs located off of various class 1s in PQ. End of Life.
- 100, 3250 Covered Hoppers located off of various class 1s in multiple locations. Sand Cars.
- 5, 2740 Mill Gondolas located off of various class 1s in NC. End of Life.
- 1, 2260 Mill Gondolas located off of various class 1s in AL. End of Life.
- 30, 2740 Mill Gondolas located off of various class 1s in multiple locations. End of Life.
- 21, 2740 Mill Gondolas located off of various class 1s in WA. End of Life.
- 9, 4750 Covered Hoppers located off of various class 1s in multiple locations. End of Life.
- 5, 4750 Covered Hoppers located off of various class 1s in multiple locations. End of Life.
- 50, 31.8K Tank CPC 1232s located off of UP or BN in TX. Requal Due in 2025.
- 100, 4600CF Open Top Hoppers located off of BN or CSX in Southeast.
Call PFL today to discuss your needs and our availability and market reach. Whether you are looking to lease cars, lease out cars, buy cars, or sell cars call PFL today at 239-390-2885
Live Railcar Markets
| CAT | Type | Capacity | GRL | QTY | LOC | Class | Prev. Use | Offer | Note |
|---|
PFL will be at the Following Conferences
- Where: La Quinta, CA
- Attending: David Cohen (954-729-4774)
- Conference Website
- Where: Hyatt Regency Dallas in Dallas, TX
- Attending:Curtis Chandler (239.405.3365), David Cohen (954-729-4774), Brian Baker (239.297.4519), Cyndi Popov(403) 402-5043
- Conference Website
The post PFL Railcar Report 2-2-2026 appeared first on PFL Petroleum Services LTD.
]]>The post PFL Railcar Report 1-26-2026 appeared first on PFL Petroleum Services LTD.
]]>Jobs Update
- Initial jobless claims seasonally adjusted for the week ending January 17, 2026 came in at 200,000, versus the adjusted number of 199,000 people from the week prior, up 1,000 people week over week.
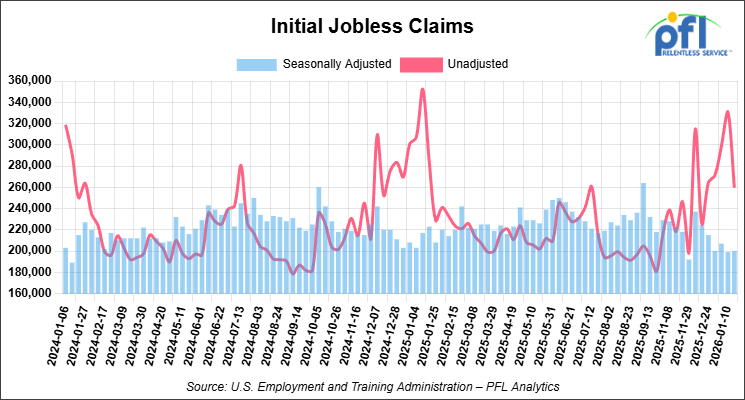
- Continuing jobless claims came in at 1,849,000, versus the adjusted number of 1,875,000 people from the week prior, down 26,000 week-over-week.

Stocks closed mixed on Friday of last week and lower week-over-week
The DOW closed lower on Friday of last week, down -285.30 points (-0.58%), closing out the week at 49,098.71, down -260.62 points week-over-week. The S&P 500 closed higher on Friday of last week, up 2.26 points (0.03%), and closed out the week at 6,915.61, down -24.40 points week-over-week. The NASDAQ closed higher on Friday of last week, up 65.22 points (0.28%), and closed out the week at 23,501.24, down -14.15 points week-over-week.
In overnight trading, DOW futures traded lower and are expected to open at 49,244 this morning, down 19 points from Friday’s close.
In other market news, it was a crazy week last week. Gold and silver continued to surge as people are losing faith in the U.S. dollar it seems. Silver closed at $101.33 per ounce and Gold closed at $4,863.10 per ounce breaching $5,000 per ounce, at one point during the trading session on Friday of last week. Natural Gas surged closing at $5.275 per MMBU at Henry Hub on Friday of last week, as fear of the deep winter freeze and well shut-ins possibly weighed on market participants. If you need a mobile boiler call, PFL today we are here to help.
Crude oil closed higher on Friday of last week and higher week-over-week
West Texas Intermediate (WTI) crude closed up $1.71 per barrel (2.9%), to close at $61.07 on Friday of last week, and up $1.63 week-over-week. Brent crude closed up $1.82 per barrel (2.8%), to close at $65.88, and up $1.75 week-over-week.
One Exchange WCS (Western Canadian Select) for March delivery settled on Friday of last week at US$15.50 below the WTI-CMA (West Texas Intermediate – Calendar Month Average). The implied value was US$45.57 per barrel. Folks, Alberta is going to hit a wall real soon. Enbridge rejected 22% of heavy crude nominations for February delivery and Transmountain pipeline is almost 90% full. Canadian basis is taking a huge hit as Canadian barrels are now competing with imports from Venezuela barrels now trading at US$9.00 below the WTI-CMA (West Texas Intermediate – Calendar Month Average).
U.S. commercial crude oil inventories (excluding those in the Strategic Petroleum Reserve) increased by 3.6 million barrels week-over-week. At 426 million barrels, U.S. crude oil inventories are 2% below the five-year average for this time of year.

Total motor gasoline inventories increased by 6 million barrels week-over-week and are 5% above the five-year average for this time of year.

Distillate fuel inventories increased by 3.3 million barrels week-over-week and are 1% below the five-year average for this time of year.

Propane/propylene inventories decreased 2.1 million barrels week-over-week and are 39% above the five-year average for this time of year.

Propane prices closed at 59.6 cents per gallon on Friday of last week, down 0.2 cents per gallon week-over-week, and down 35.2 cents year-over-year.
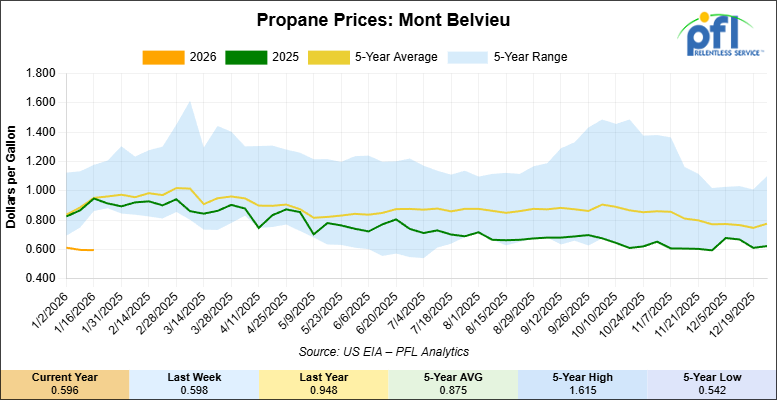
Overall, total commercial petroleum inventories increased by 7.5 million barrels week-over-week, during the week ending January 16, 2026.
U.S. crude oil imports averaged 6.4 million barrels per day during the week ending January 16, 2026, a decrease of 645,000 barrels per day week-over-week. Over the past four weeks, crude oil imports averaged 6.2 million barrels per day, 5.3% less than the same four-week period last year. Total motor gasoline imports (including both finished gasoline and gasoline blending components) averaged 412,000 barrels per day, and distillate fuel imports averaged 215,000 barrels per day during the week ending January 16, 2026.

U.S. crude oil exports averaged 3.688 million barrels per day during the week ending January 16, 2026, a decrease of 618,000 barrels per day week-over-week. Over the past four weeks, crude oil exports averaged 3.924 million barrels per day.
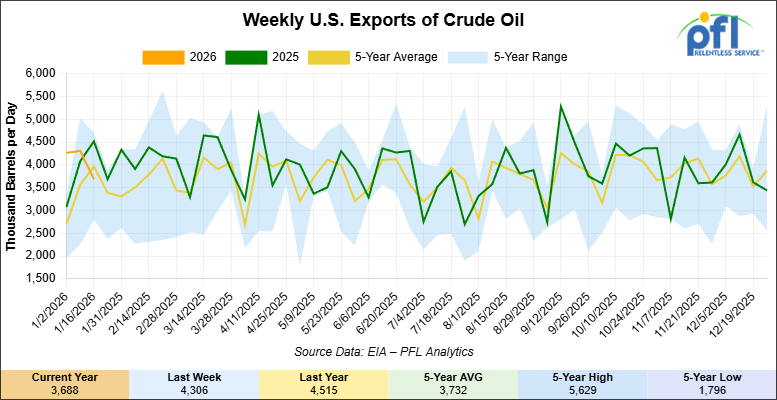
U.S. crude oil refinery inputs averaged 16.6 million barrels per day during the week ending January 16, 2026, which was 354,000 barrels per day less week-over-week.

WTI is poised to open at 61.22, up 16 cents per barrel from Friday’s close.
North American Rail Traffic
Week Ending January 21, 2026:
Total North American weekly rail volumes were down (-1.14%) in week 4, compared with the same week last year. Total Carloads for the week ending January 21, 2026 were 322,203, up (+1.31%) compared with the same week in 2024, while weekly Intermodal volume was 339,469, down (-3.37%) year over year. 8 of the AAR’s 11 major traffic categories posted year-over-year decreases. The largest decrease came from Forest Products (-22.62%), while the largest increase was Grain (+21.10%).
In the East, CSX’s total volumes were up (+1.25%), with the largest decrease coming from Forest Products (-12.07%), while the largest increase came from Grain (+17.17%). NS’s total volumes were up (+0.44%), with the largest increase coming from Nonmetallic Minerals (+17.12%), while the largest decrease came from Forest Products (-9.22%).
In the West, BNSF’s total volumes were up (+1.92%), with the largest increase coming from Grain (+26.20%), while the largest decrease came from Other (-27.91%). UP’s total volumes were down (-3.47%), with the largest increase coming from Grain (+20.05%), while the largest decrease came from Intermodal Units (-10.61%).
In Canada, CN’s total volumes were up (+2.47%), with the largest increase coming from Coal (+17.34%), while the largest decrease came from Motor Vehicles and Parts (-25.38%). CPKCS’s total volumes were down (-22.12%), with the largest increase coming from Grain (+28.00%), while the largest decrease came from Forest Products (-70.31%).
Source Data: AAR – PFL Analytics
North American Rig Count Summary
Rig Count
North American rig count was up by +6 rigs week-over-week. The U.S. rig count was up by +1 rig week-over-week, but down by -32 rigs year-over-year. The U.S. currently has 544 active rigs. Canada’s rig count was up by +5 rigs week-over-week, but down by -14 rigs year-over-year. Canada currently has 231 active rigs. Overall, year-over-year we are down by -46 rigs collectively.
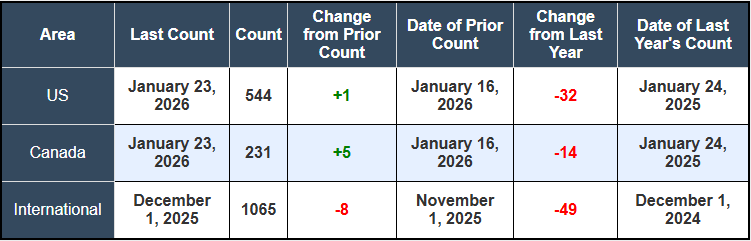
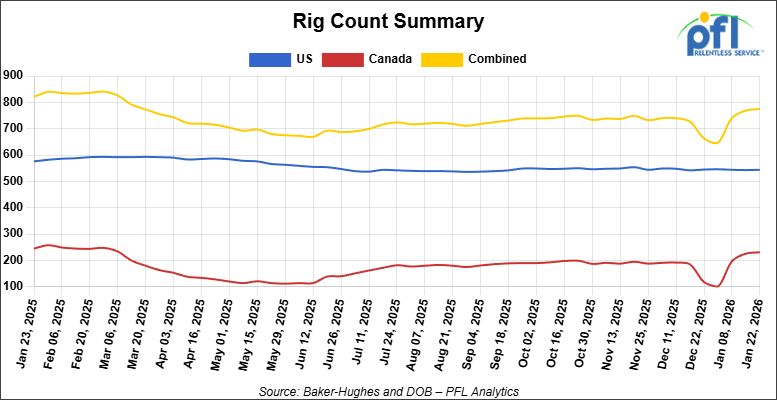
We are watching a few things out there for you:
We are watching the Weather
Deadly winter storm set in over the weekend, halting rail operations across the country including a few PFL locations. Here is what we know:
Deadly cold: At least 11 people have died in the coldest temperatures of the winter. The brutal cold will linger into the week, with nearly 90 million people under Extreme Cold Watches or Warnings, raising fears for those without shelter or power for days.
• Crippling: More than 800,000 customers are still without power after damaging ice knocked it out. Here’s what to do if you’re without power.
•No travel, no school: Sunday was the worst day for flight cancellations since the pandemic. Over 19,000 flights were canceled during this storm. Schools in major cities have canceled classes or moved to remote learning for today.
• Snow: A staggering 15 states have seen snow pile up a foot or higher.
Today’s Forecast
Source: National Weather Service – PFL Analytics
Stay safe and stay warm out there. If you require any assistance call PFL now at 239-390-2885.
We are Watching Petroleum Carloads
The four-week rolling average of petroleum carloads carried on the six largest North American railroads fell to 28,558 from 28,731, which was a decrease of -173 rail cars week-over-week. Canadian volumes were lower. CPKC’s shipments were lower by -5.0% week-over-week, CN’s volumes were lower by -2.0% week-over-week. U.S. shipments were mostly lower. The BN had the largest percentage decrease and was down by -16.0%. The CSX was the sole gainer and was up by +4.0%.
We are watching Alberta Butane
Alberta’s butane market is now seeing impacts from an extended outage at Keyera’s AEF fractionation plant, which has been offline since early December 2025 and is expected to remain out of service until late March or early April 2026. While the outage itself is not new, its effects are becoming more visible as the market moves deeper into the downtime window.
AEF is a key component of Western Canada’s NGL system, producing purity products such as butane used largely for gasoline blending. With the facility down for roughly four months, Alberta butane supply has been reduced through the heart of winter, weighing on demand as blending economics soften and buyers adjust to lower availability.
Early in the outage, the market was able to manage the disruption using inventories and short-term logistical adjustments. As January turns to February, those buffers are thinning. That is when the impact starts to show up more clearly: in pricing relationships, storage behavior, and rail activity, making the outage increasingly relevant now for shippers and service providers.
Alberta butane pricing has weakened relative to other North American hubs, reflecting the loss of production rather than a demand-driven shift. The effect on U.S. markets has been limited. U.S. supply remains ample, and there is little indication that the outage is pulling incremental barrels south. Instead, Canadian volumes are effectively sidelined until AEF returns, leaving broader U.S. market fundamentals largely unchanged.
For rail, this is not a story about cross-border surges, it’s about reduced Western Canadian NGL movement during the outage period:
- No material increase in U.S.-bound Canadian butane traffic;
- Fewer outbound butane rail shipments tied to winter blending demand;
- Operational adjustments as shippers manage equipment and timing during the outage.
As the outage moves into its later stages in February and March, rail decisions around car placement, storage duration, and spring repositioning are becoming more active. Once the AEF plant returns to service, butane supply, and associated rail activity, is expected to recover relatively quickly.
Near-term NGL rail activity in Western Canada remains subdued pending the plant’s return to service later this spring.
PFL supports customers to help manage changing rail dynamics, whether that means adjusting dwell strategies, coordinating movements, or staying prepared for a restart when volumes return. Call PFL today, we are here to help.
We are Watching Grain
It is going to get real busy, folks. Grain-related rail activity across North America is starting to shift as the market looks past winter constraints and toward spring export and domestic demand programs. While volumes remain seasonally muted, rail positioning and planning activity picked up last week as elevators, traders, and railroads prepare for heavier movement later in Q1 and early Q2.
In both the U.S. and Canada, winter operating conditions have limited near-term velocity, particularly for covered hopper traffic moving through northern corridors. Even so, grain supply remains ample, and railroads are beginning to align equipment and network capacity ahead of the next demand window.
The transition is visible across major grain corridors served by BNSF Railway, Union Pacific, and Canadian Pacific Kansas City, where winter constraints are gradually giving way to early spring planning. While this is not yet a volume surge, it marks the point where railcar placement, routing, and cycle expectations begin to shift.
Export markets are a key driver. As river conditions, port programs, and international demand firm up, rail becomes increasingly important for positioning grain to coastal terminals and domestic processors. That dynamic is especially relevant for Canadian grain movements, where rail is the primary link between inland production and export facilities.
We are watching Left Wing Canadian Prime Minister Carney
Well, we knew that the trade deal that left-wing Carney cut with China to buy electric cars from China in exchange for Canada selling the Chinese canola wasn’t to go over well with President Trump and it didn’t. Trump reacted via truth Social over the weekend on Saturday threatening to impose a 100% tariff on goods imported from Canada if Carney went ahead with its trade deal with China.
Mr. Trump said in a social media post that if Canadian Prime Minister Mark Carney “thinks he is going to make Canada a ‘Drop Off Port’ for China to send goods and products into the United States, he is sorely mistaken.”
Mr. Trump initially had said that agreement was what Carney “should be doing and it’s a good thing for him to sign a trade deal.”
We Continue to Watch the UP and NS Merger
The STB issued a decision unanimously rejecting the merger application filed by UP and NS “because the STB says it does not contain certain information required by the board’s regulations. Which includes “future market share projections showing the combined effects of merger-related growth, diversions, and merger-influenced and other changes to market conditions that applicants anticipate.”
According to the STB, the submission from UP and NS includes their Agreement and Plan of Merger but does not include “certain schedules and documents that are expressly made part of the merger agreement and that define applicants’ obligations under it.” UP and NS have made no attempt to justify why these materials were withheld from the board, the STB says.
UP and NS have until February 17th to inform the STB if they intend to resubmit their application. On January 16th,UP and NS issued a brief statement confirming their intention to do so. Stay tuned to PFL for further updates. We are watching this one closely!
We Continue to Watch Safety and Operational Developments
The National Transportation Safety Board issued its preliminary report last Monday for its investigation of a December 13, 2025, CSX train collision and subsequent derailment in Alabama, which resulted in the death of a CSX conductor. The accident occurred near milepost 421.5 on CSX’s South and North Alabama subdivision near Calera, Alabama. At 2:13 a.m. local time, the conductor was riding on a rail car being shoved from the main track into an auxiliary track. The rail car collided with a second rail car that had been cut from the train and left on the main track.
The collision caused three railcars to derail, including the railcar the conductor was riding. That car overturned, causing the conductor’s death. NTSB’s ongoing investigation will focus on hazard identification and mitigation strategies, CSX’s rules and procedures related to leaving rail cars clear of adjacent tracks, and internal and external oversight. The Federal Railroad Administration, the Alabama Public Service Commission, CSX and two labor unions are parties to the investigation.
The incident highlights ongoing safety concerns in the rail industry at a time when the proposed UP-NS merger is drawing intense scrutiny over labor and safety implications. Earlier this month, the Federal Railroad Administration announced it had collected a record $15.4 million in civil penalties from Class I railroads under a new streamlined settlement process for safety violations, including defective wheels and other equipment issues. The intersection of safety enforcement, labor scrutiny, and merger oversight creates operational and regulatory uncertainty for the industry in 2026.
We are watching Class 1 Industry Headcount
Class I’s employed 116,451 workers in the United States in December, a -0.52% decrease from November 2025’s count and a -3.09% year-over-year decrease, according to Surface Transportation Board data.
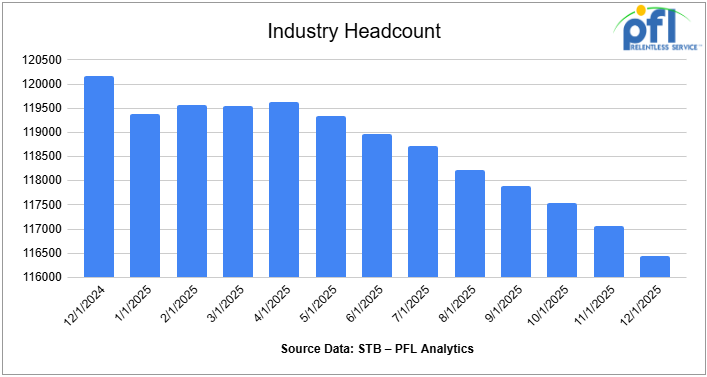
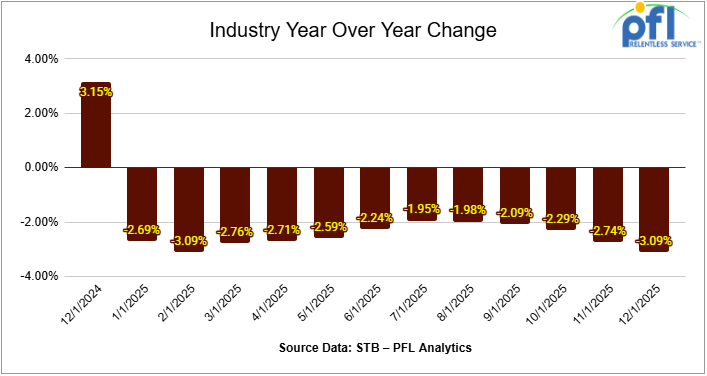
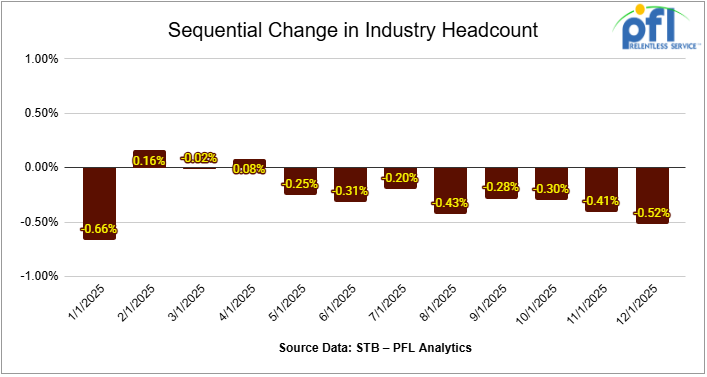
Two of the six employment categories posted month-over-month increases between November and December. They were: executives, officials, and staff assistants, up 0.02% to 8,146 workers; and maintenance of equipment and stores, up 0.05% to 16,405.
Categories that posted month-over-month decreases were maintenance of way and structures, down -0.62% to 28,680; professional and administrative, down -0.13% to 8,932; transportation (other than train and engine), down -0.29% to 4,794; and transportation (train and engine), down -0.82% to 49,494.
Year-over-year, one category posted an employment gain: executives, officials, and staff assistants, up 3.86%.
Categories that registered year-over-year decreases in December were professional and administrative, -7.27%; transportation (other than train and engine), -4.94%; transportation (train and engine), -4.46%; maintenance of equipment and stores, -4.38%; and maintenance of way and structures, -0.04%.
We are Watching Key Economic Indicators
Industrial Output and Capacity Utilization
Manufacturing accounts for approximately 75% of total output. Manufacturing output in December was up 0.03% from November 2025.
Capacity utilization is a measure of how fully firms are using machinery and equipment. Capacity utilization was down -0.10% from November to December.
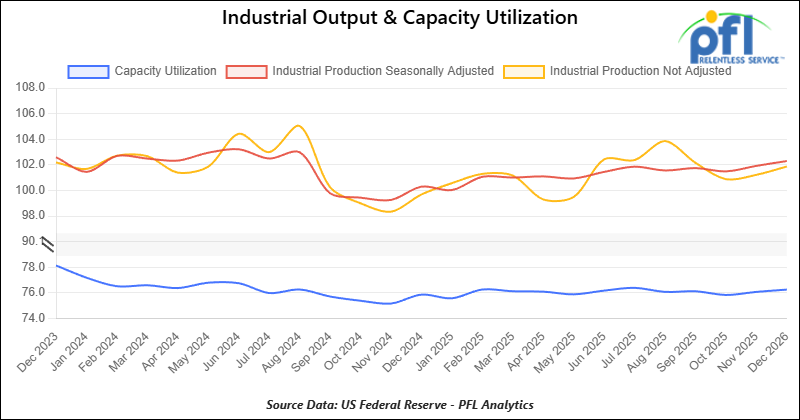
Lease Bids
- 30-50, 6000cf Steel Hopper located off of CSX or NS in East. For use in petcoke service. Period: 5 Years.
- 10, 2500CF Open Top Hopper located off of UP or BN in Texas. For use in aggregate service. Period: 5 years. Need Rapid Discharge Doors.
- 100, 21.9K 117J Tank located off of All Class 1s in Midwest. For use in CO2 service. Period: 6 months.
- 30-50, 30K 117J Tank located off of NS or CSX in Northeast. For use in C5 service. Period: 1 year.
- 60, 33K 340W Tank located off of BNSF in UT/AZ. For use in Propane service. Period: Trip Lease.
Sales Bids
- 28, 3400CF Hopper Covered located off of UP BN in Texas. For use in Cement service. Cement Gates needed.
- 20, 17K Tank DOT111 located off of various class 1s in various locations. For use in corn syrup service.
- 120, Various Gondola Open-Top Aluminum Rotary located off of various class 1s in various locations. For use in Sulphur service. Built 2004 or later.
- 30, 29K Tank DOT111 located off of various class 1s in Chicago. For use in Veg Oil service.
Lease Offers
- 100, 30K CPC1232 Tanks located off of UP or BN in Texas. Last used in Diesel.
- 100, 30K DOT117J Tanks located off of UP or BN in Texas. Last used in Gasoline.
- 100, 29K DOT117J Tanks located off of UP or BN in Texas. Last used in Gasoline. Coiled and Insulated.
- 36, 6351 Covered Hopper located off of CN in Wisconsin. Last used in Grain. through 2/27.
- 29, 6580 Covered Hopper located off of CN in Wisconsin. Last used in Grain. through 2/26.
- 18, 6580 Covered Hopper located off of CN in Wisconsin. Last used in Grain. through 2/27.
- 9, 5400 Covered Hopper located off of CN in Wisconsin. Last used in Grain. through 2/27.
- 21, 6351 Covered Hopper located off of CN in Wisconsin. Last used in DDG. Available until February 2027.
- 29, 6500 Covered Hopper located off of CN in Wisconsin. Last used in DDG. Available until February 2027.
- 50, 5380 Covered Hopper located off of UP or BN in Houston. Last used in Fertilizer. Cars are currently clean. Available until February.
- 50, 20K DOT117J Tank located off of All Class 1s in Moving. Last used in Styrene.
- 29, 25.5K DOT117J Tank located off of UP or BN in Texas. Cars are currently clean. Cars are currently clean.
- 90, 30K DOT117J Tank located off of UP or BN in Corpus Christie. Last used in Diesel.
Sales Offers
- 21, 50′ Boxcar Plate Cs located off of various class 1s in NM. End of Life.
- 3, 50′ Boxcar Plate Cs located off of various class 1s in multiple locations. End of Life.
- 27, 50′ Boxcar Plate Cs located off of various class 1s in PQ. End of Life.
- 100, 3250 Covered Hoppers located off of various class 1s in multiple locations. Sand Cars.
- 5, 2740 Mill Gondolas located off of various class 1s in NC. End of Life.
- 1, 2260 Mill Gondolas located off of various class 1s in AL. End of Life.
- 30, 2740 Mill Gondolas located off of various class 1s in multiple locations. End of Life.
- 21, 2740 Mill Gondolas located off of various class 1s in WA. End of Life.
- 9, 4750 Covered Hoppers located off of various class 1s in multiple locations. End of Life.
- 5, 4750 Covered Hoppers located off of various class 1s in multiple locations. End of Life.
- 50, 31.8K Tank CPC 1232s located off of UP or BN in TX. Requal Due in 2025.
- 100, 4600CF Open Top Hoppers located off of BN or CSX in Southeast.
Call PFL today to discuss your needs and our availability and market reach. Whether you are looking to lease cars, lease out cars, buy cars, or sell cars call PFL today at 239-390-2885
Live Railcar Markets
| CAT | Type | Capacity | GRL | QTY | LOC | Class | Prev. Use | Offer | Note |
|---|
PFL will be at the Following Conferences
- Where: La Quinta, CA
- Attending: David Cohen (954-729-4774)
- Conference Website
- Where: Hyatt Regency Dallas in Dallas, TX
- Attending:Curtis Chandler (239.405.3365), David Cohen (954-729-4774), Brian Baker (239.297.4519), Cyndi Popov(403) 402-5043
- Conference Website
The post PFL Railcar Report 1-26-2026 appeared first on PFL Petroleum Services LTD.
]]>The post PFL Railcar Report 1-20-2026 appeared first on PFL Petroleum Services LTD.
]]>Jobs Update
- Initial jobless claims seasonally adjusted for the week ending January 10, 2026 came in at 198,000, versus the adjusted number of 207,000 people from the week prior, down 9,000 people week over week.
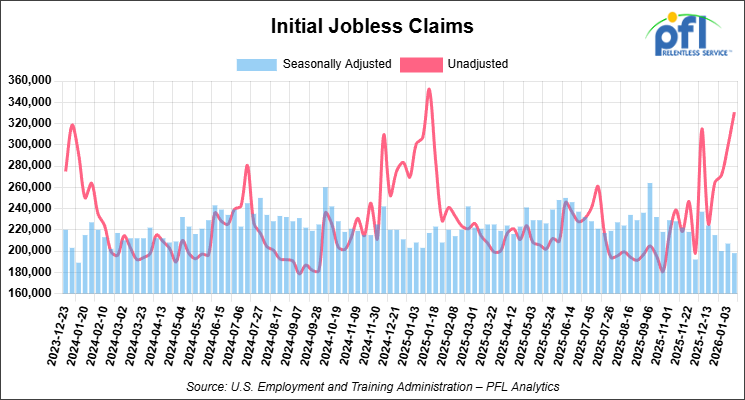
- Continuing jobless claims came in at 1,884,000, versus the adjusted number of 1,903,000 people from the week prior, down 19,000 week-over-week.
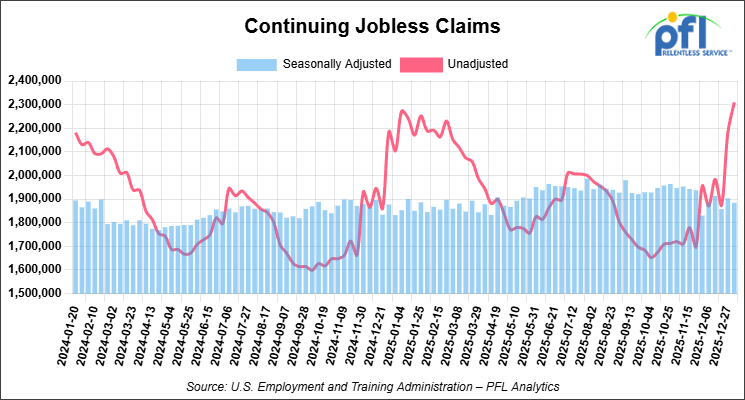
Stocks closed lower on Friday of last week and lower week-over-week
The DOW closed lower on Friday of last week, down -83.11 points (-0.17%), closing out the week at 49,359.33, down -144.74 points week-over-week. The S&P 500 closed lower on Friday of last week, down -4.46 points (-0.06%), and closed out the week at 6,940.01, down -26.27 points week-over-week. The NASDAQ closed lower on Friday of last week, down -14.63 points (-0.06%), and closed out the week at 23,515.39, down -155.96 points week-over-week.
In overnight trading, DOW futures traded higher and are expected to open at 48,841 this morning, down -706 points from Friday’s close.
Crude oil closed higher on Friday of last week and higher week-over-week
West Texas Intermediate (WTI) crude closed up 25 cents per barrel (0.4%), to close at $59.44 on Friday of last week, and up $0.32 week-over-week. Brent crude closed up 37 cents per barrel (0.6%), to close at $64.13, and up 79 cents week-over-week.
On a side note, the U.S. Energy Information Administration projected last week that WTI will average $52 per barrel in 2026 and $50 per barrel in 2027, down from $65 per barrel in 2025, as global crude surplus persists. Brent is forecast at $56 per barrel in 2026 and $54 per barrel in 2027. As global oil inventories continue to swell.
U.S. crude production is forecast to hold steady at 13.6 million bpd in 2026 before declining to 13.3 million bpd in 2027. Lower prices also compress netbacks for crude-by-rail movements, as transportation costs consume a larger share of realized pricing.
One Exchange WCS (Western Canadian Select) for February delivery settled on Friday of last week at US$14.20 below the WTI-CMA (West Texas Intermediate – Calendar Month Average). The implied value was US$44.83 per barrel.
U.S. commercial crude oil inventories (excluding those in the Strategic Petroleum Reserve) increased by 3.4 million barrels week-over-week. At 422.4 million barrels, U.S. crude oil inventories are 3% below the five-year average for this time of year.

Total motor gasoline inventories increased by 9 million barrels week-over-week and are 4% above the five-year average for this time of year.
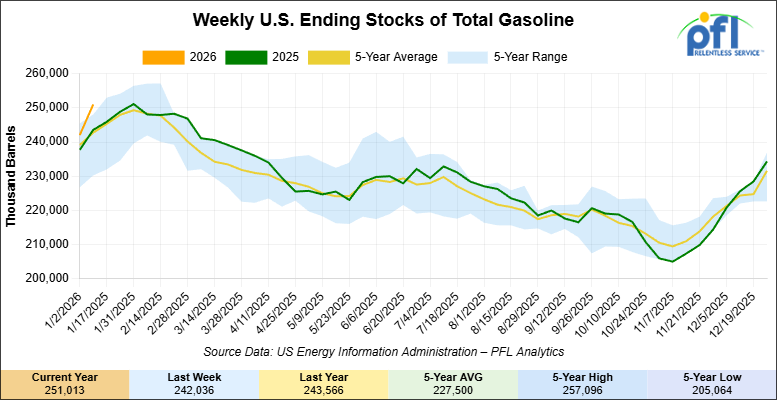
Distillate fuel inventories slightly decreased week-over-week and are 4% below the five-year average for this time of year.
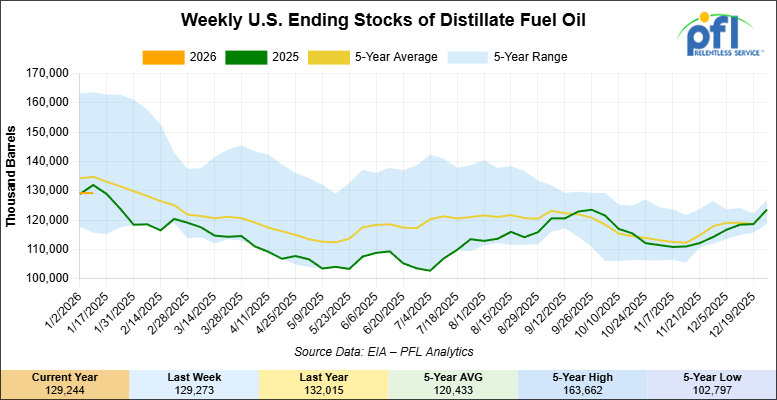
Propane/propylene inventories decreased 2.4 million barrels week-over-week and are 33% above the five-year average for this time of year.
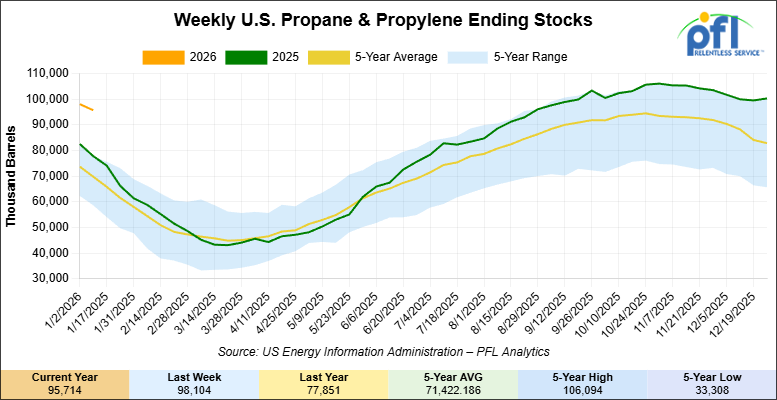
Propane prices closed at 59.8 cents per gallon on Friday of last week, down 1.5 cents per gallon week-over-week, and down 27 cents per gallon year-over-year.

Overall, total commercial petroleum inventories increased by 6.2 million barrels week-over-week, during the week ending January 9, 2026.
U.S. crude oil imports averaged 7.1 million barrels per day last week, an increase of 752,000 barrels per day week-over-week. Over the past four weeks, crude oil imports averaged 6.1 million barrels per day, 5.7% less than the same four-week period last year. Total motor gasoline imports (including both finished gasoline and gasoline blending components) averaged 448,000 barrels per day, and distillate fuel imports averaged 220,000 barrels per day, during the week ending January 9, 2026.
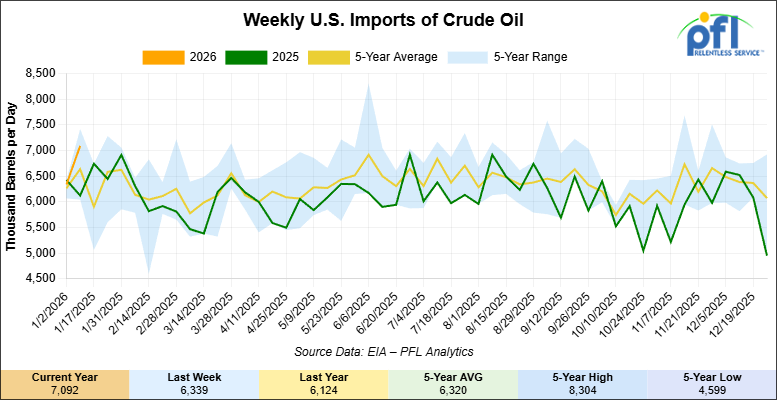
U.S. crude oil exports averaged 4.306 million barrels per day during the week ending January 9, 2026, an increase of 43,000 barrels per day week-over-week. Over the past four weeks, crude oil exports averaged 3.906 million barrels per day.

U.S. crude oil refinery inputs averaged 17 million barrels per day during the week ending January 9, 2026, which was 48,000 barrels per day more week-over-week.
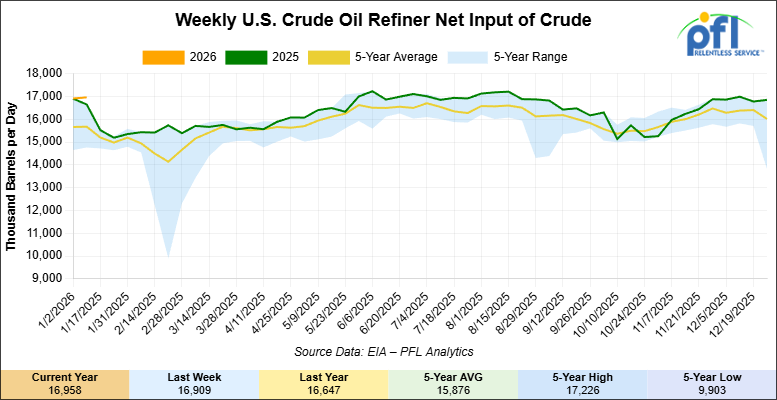
WTI futures are poised to open at $59.51, up 17 cents from Friday’s close.
North American Rail Traffic
Week Ending January 14, 2026:
Total North American weekly rail volumes were up (+5.03%) in week 3, compared with the same week last year. Total Carloads for the week ending January 14, 2026 were 319,058, up (+8.75%) compared with the same week in 2024, while weekly Intermodal volume was 324,384, up (+1.62%) year over year. 3 of the AAR’s 11 major traffic categories posted year-over-year decreases. The largest decrease came from Forest Products (-19.30%), while the largest increase was Coal (+32.31%).
In the East, CSX’s total volumes were up (+11.11%), with the largest decrease coming from Metallic Ores and Metals (-14.32%), while the largest increase came from Nonmetallic Minerals (+31.07%). NS’s total volumes were up (+11.10%), with the largest increase coming from Coal (+35.21%), while the largest decrease came from Grain (-8.17%).
In the West, BNSF’s total volumes were up (+6.14%), with the largest increase coming from Coal (+26.07%), while the largest decrease came from Forest Products (-20.30%). UP’s total volumes were up (+3.13%), with the largest increase coming from Grain (+50.66%), while the largest decrease came from Motor Vehicles and Parts (-29.70%).
In Canada, CN’s total volumes were down (-4.13%), with the largest increase coming from Other (+65.18%), while the largest decrease came from Nonmetallic Minerals (-20.61%). CPKCS’s total volumes were down (-19.93%), with the largest increase coming from Nonmetallic Minerals (+39.53%), while the largest decrease came from Forest Products (-67.06%).
Source Data: AAR – PFL Analytics
North American Rig Count Summary
Rig Count
North American rig count was up by +28 rigs week-over-week. The U.S. rig count was down by -1 rig week-over-week, and down by -37 rigs year-over-year. The U.S. currently has 543 active rigs. Canada’s rig count was up by +29 rigs week-over-week, but down by -3 rigs year-over-year. Canada currently has 226 active rigs. Overall, year-over-year we are down by -40 rigs collectively.
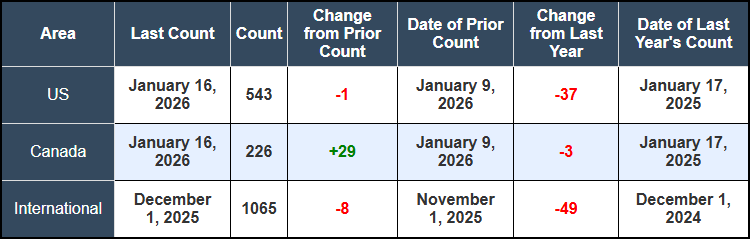

We are watching a few things out there for you:
We are Watching Iran
Folks, last week was a volatile and unpredictable week. Large-scale protests in Iran have persisted for three weeks now, and last week was no different, raising supply disruption concerns for a country producing 3.3 million barrels per day. Call skew in crude options hit its highest level since June, with Brent trading above $64/barrel and WTI rallying to early November highs. Bloomberg, however, estimates that only a modest war premium of around $4 per barrel is currently built into prices.
President Trump announced a 25% tariff on goods from countries doing business with Iran, taking effect January 12. Trump stated on Friday of last week that Tehran’s response was subsiding and indicated he was considering “very strong options” for assistance to protesters and is positioning military assets from the China Sea to the Middle East.
Approximately 20% of global oil and LNG shipments transit the Strait of Hormuz, which Iran could theoretically disrupt, though analysts assess extended closure as unlikely given Iran’s dependence on oil export revenue and international security forces.
We are Watching Petroleum Carloads
The four-week rolling average of petroleum carloads carried on the six largest North American railroads rose to 28,731 from 28,391, which was an increase of +340 rail cars week-over-week. Canadian volumes were higher. CPKC’s shipments were higher by +10.0% week-over-week, CN’s volumes were higher by +17.0% week-over-week. U.S. shipments were mixed. The BN had the largest percentage increase and was up by +16.0%. The NS had the largest percentage decrease and was down by -10.0%.
The Canadian strength came despite widening price spreads that typically discourage long-haul crude-by-rail movements. Western Canada Select closed at a $14.20 discount to WTI more than $1.00 wider month over month. CIBC analysts forecast the WCS discount will average -$14.25 in 2026 versus -$11.30 in 2025, driven largely by Venezuelan crude competing for U.S. Gulf coast refinery demand.
More Canadian crude-by-rail volumes seem to be flowing to domestic refineries or shorter-haul destinations rather than long-haul U.S. Gulf coast movements, which have become less economical. The U.S. finalized its first $500 million sale of Venezuelan crude last week. Venezuelan crude production is expected to recover to 1.5 million barrels per day by mid-2026, up from 800,000 barrels per day currently. Texas refiners imported an average of 392,000 barrels per day from Canada between January-October 2025, but Venezuelan heavy crude entering the Gulf coast threatens to displace meaningful Canadian volumes and erode crude-by-rail demand on southbound routes.
We are Watching Trans Mountain
Waterborne crude exports from the Trans Mountain pipeline system fell to 467,000 barrels per day in December, the lowest level since August, signaling softer demand for Canadian heavy crude in Asia-Pacific markets. Heavy crude loadings accounted for 423,000 bpd. China remained the largest destination at 356,000 bpd, down 20% from November.
The decline reflected competitive pricing pressures from rival crudes and the absence of major buyer Yulong, which was sanctioned by the UK and EU in mid-December. Weaker TMX pipeline utilization typically correlates with stronger crude-by-rail demand as producers seek alternative takeaway capacity. However, the concurrent widening of WCS discounts suggests the issue is demand-side rather than pipeline capacity constraints, limiting the spillover benefit to rail.
Alberta Premier Danielle Smith announced last week that the province intends to submit a proposal for a 1 million bpd bitumen pipeline to northwest British Columbia by June 2026, with federal approval targeted within six months. Smith explicitly framed the urgency: “to avoid losing market share to Venezuela”. If constructed, the pipeline would further reduce long-term crude-by-rail demand from Western Canada by adding significant incremental pipeline capacity to Pacific tidewater. Construction could begin as early as 2029 if approval is granted by mid-2028. We are beginning to question the urgency of a new pipeline out to the west coast as a matter of urgency when we are having trouble filling Transmountain right now – hopefully demand will pick up soon!!!
We are Watching Enbridge
Enbridge announced construction on its 150,000 bpd Mainline expansion could begin as early as July 2026, with completion now forecast for December 2027. The project will increase Line 93 capacity from Hardisty to Superior from 760,000 barrels per day to 837,000 barrels per day using drag-reducing agents rather than new pipeline construction.
Enbridge’s mainline apportionment—the percentage by which crude nominations exceed available pipeline capacity—has remained elevated despite optimization efforts. The 150,000 barrel per day expansion, combined with Alberta’s proposed 1 million bpd Pacific pipeline, would add meaningful incremental pipeline capacity over the 2027-2030 period, likely keeping structural demand muted for crude-by-rail in Western Canada. Crude by rail out of Canada will always be needed for stranded barrels and raw bitumen (no diluent added), which can move as a non hazard product.
We are Watching Left Wing Carney
Left-wing Prime Minister Mark Carney announced a landmark trade agreement with China last Friday that could fundamentally alter North American rail traffic flows over the coming decade. The deal reduces Canada’s 100% tariff on Chinese electric vehicles to 6.1% for an initial quota of 49,000 vehicles annually, rising to approximately 70,000 over five years, while China slashes tariffs on Canadian canola from 84% to 15% and eliminates 100% tariffs on canola meal.
For railroads, the agreement has three critical implications. First, the canola tariff relief should support stronger Canadian grain carload volumes to Pacific ports as China resumes large-scale purchases. Canola represents one of the largest export grain commodities by rail in Western Canada, and the 84% Chinese tariff had sharply curtailed demand since 2024. Second, the deal establishes a ministerial energy dialogue covering Canadian oil, LNG, and natural uranium exports to China, potentially supporting long-haul crude-by-rail economics if new commercial purchase commitments materialize. Third, Chinese automotive investment commitments within three years could generate new finished vehicle and automotive parts traffic, particularly if Chinese EV manufacturers establish North American production capacity.
President Trump expressed support for the deal, though U.S. Trade Representative Howard Greer warned Canada would “surely regret” the decision. Ontario Premier Doug Ford criticized the agreement, warning it would “harm our economy and result in job losses,” while Saskatchewan Premier Scott Moe endorsed it as creating “new opportunities for Canadians”.
Carney stated Canada plans to double non-U.S. exports within 10 years. For Class I railroads operating in Canada—CN, CPKC—this represents a structural shift toward Pacific export corridors and away from traditional U.S.-bound traffic, with direct implications for intermodal routing, unit train utilization, and terminal capacity planning on the west coast.
We are Watching the NS
Norfolk Southern reported a 30% year-over-year increase in transformer shipments, driven by electrical grid infrastructure replacement, clean energy deployment, and AI data center construction. The railroad coordinated specialized dimensional shipments, including 160 wind turbine nacelles from Colorado to North Carolina for Vestas and nuclear turbine rotors for Georgia Power’s Vogtle plant.
Dimensional freight – cargo exceeding standard rail car dimensions or the 286,000-pound weight limit – requires specialized flat cars, custom routing using lidar clearance verification, and coordination with network operations centers to prevent conflicts with other traffic. Most dimensional projects are one-time movements rather than recurring traffic, but the volume growth reflects sustained capital investment in energy infrastructure that generates incremental railcar demand.
Virginia’s Hitachi Energy is investing $457 million to expand its power transformer plant in South Boston, which will become the largest U.S. facility for industrial transformers. NS provides rail service to the campus and expects continued dimensional shipment growth as clean energy and data center projects accelerate. Bernie Williams, NS group vice president of industrial products, stated he doesn’t see demand for large transformers falling off anytime soon, given aging grid infrastructure, clean energy buildout, EV adoption, and AI data center growth.
Transformer and heavy equipment movements typically utilize specialized heavy-duty flat cars in the 250-400 ton capacity, a segment dominated by private car owners and leasing companies rather than railroad-owned fleets.
We are Watching West Coast Intermodal
Port of Oakland handled 179,580 twenty-foot equivalents in December, down 1.7% year-over-year, with loaded imports falling 12.8%. For all of 2025, Oakland’s total volume was essentially flat at -0.4%. The port characterized maintaining stability in “an environment defined by uncertainty” as a notable outcome given policy and economic volatility.
West Coast ports outside Southern California faced challenges from Trump’s tariff policies on China, shifting ocean carrier trade patterns, and aggressive growth by Canadian ports Vancouver and Prince Rupert, which have leveraged cross-border rail services to attract U.S.-bound Midwest intermodal traffic. Maritime Director Bryan Brandes noted December reflected “the kind of uneven performance we’ve seen across the industry, with softer imports and strong export activity”.
The weakness in West Coast import volumes flows through to domestic intermodal rail traffic, particularly for BNSF and UP, which serve as primary rail carriers from Oakland and other Pacific coast gateways to inland markets. Carney’s China deal could eventually reverse some of this weakness if it generates stronger bilateral trade flows, though the immediate impact will be felt in Canadian ports rather than U.S. terminals.
Producer Price Index
In November 2025, the Producer Price Index (PPI) for final demand increased 0.2% month over month, following a 0.1% gain in October, indicating contained but persistent upstream inflation pressures. Core PPI (final demand less foods, energy, and trade services) also rose 0.2% month over month, steady with October. The monthly increase was driven primarily by goods, which advanced 0.9%, reflecting a strong rise in energy prices (+4.6%), while food prices were unchanged (0.0%). Goods, less food and energy, increased 0.2%. Services were flat (0.0%) overall. Within services, trade margins declined 0.8%, transportation and warehousing rose 0.3%, and services excluding trade, transportation, and warehousing increased 0.3%.
In November 2025, the Consumer Price Index (CPI) report indicated that headline consumer prices rose 2.7% on a year-over-year basis, down from 3.0% in September and below market expectations. Because the Bureau of Labor Statistics did not collect sufficient price data during October 2025 due to the federal government shutdown, standard month-over-month percent changes for November are unavailable; instead, the BLS reported the two-month combined change from September to November, which amounts to a 0.2% increase in CPI overall and a 0.2% rise in core CPI (all items less food and energy) over that same period. Shelter inflation contributed moderately, while food and energy subindexes showed modest gains within that bi-monthly comparison. Over 12 months, core CPI rose approximately 2.6%, reflecting slower underlying inflation pressures relative to earlier in the year.

Lease Bids
- 30-50, 6000cf Steel Hopper located off of CSX or NS in East. For use in petcoke service. Period: 5 Years.
- 10, 2500CF Open Top Hopper located off of UP or BN in Texas. For use in aggregate service. Period: 5 years. Need Rapid Discharge Doors.
- 100, 21.9K 117J Tank located off of All Class 1s in Midwest. For use in CO2 service. Period: 6 months.
- 30-50, 30K 117J Tank located off of NS or CSX in Northeast. For use in C5 service. Period: 1 year.
- 60, 33K 340W Tank located off of BNSF in UT/AZ. For use in Propane service. Period: Trip Lease.
Sales Bids
- 28, 3400CF Hopper Covered located off of UP BN in Texas. For use in Cement service.Cement Gates needed.
- 20, 17K Tank DOT111 located off of various class 1s in various locations. For use in corn syrup service.
- 120, Various Gondola Open-Top Aluminum Rotary located off of various class 1s in various locations. For use in Sulphur service.Built 2004 or later.
- 30, 29K Tank DOT111 located off of various class 1s in Chicago. For use in Veg Oil service.
Lease Offers
- 100, 30K CPC1232 Tanks located off of UP or BN in Texas. Last used in Diesel.
- 100, 30K DOT117J Tanks located off of UP or BN in Texas. Last used in Gasoline.
- 100, 29K DOT117J Tanks located off of UP or BN in Texas. Last used in Gasoline. Coiled and Insulated.
- 36, 6351 Covered Hopper located off of CN in Wisconsin. Last used in Grain. through 2/27.
- 29, 6580 Covered Hopper located off of CN in Wisconsin. Last used in Grain. through 2/26.
- 18, 6580 Covered Hopper located off of CN in Wisconsin. Last used in Grain. through 2/27.
- 9, 5400 Covered Hopper located off of CN in Wisconsin. Last used in Grain. through 2/27.
- 21, 6351 Covered Hopper located off of CN in Wisconsin. Last used in DDG. Available until February 2027.
- 29, 6500 Covered Hopper located off of CN in Wisconsin. Last used in DDG. Available until February 2027.
- 50, 5380 Covered Hopper located off of UP or BN in Houston. Last used in Fertilizer. Cars are currently clean. Available until February.
- 50, 20K DOT117J Tank located off of All Class 1s in Moving. Last used in Styrene.
- 29, 25.5K DOT117J Tank located off of UP or BN in Texas. Cars are currently clean. Cars are currently clean.
- 90, 30K DOT117J Tank located off of UP or BN in Corpus Christie. Last used in Diesel.
Sales Offers
- 21, 50′ Boxcar Plate Cs located off of various class 1s in NM. End of Life.
- 3, 50′ Boxcar Plate Cs located off of various class 1s in multiple locations. End of Life.
- 27, 50′ Boxcar Plate Cs located off of various class 1s in PQ. End of Life.
- 100, 3250 Covered Hoppers located off of various class 1s in multiple locations. Sand Cars.
- 5, 2740 Mill Gondolas located off of various class 1s in NC. End of Life.
- 1, 2260 Mill Gondolas located off of various class 1s in AL. End of Life.
- 30, 2740 Mill Gondolas located off of various class 1s in multiple locations. End of Life.
- 21, 2740 Mill Gondolas located off of various class 1s in WA. End of Life.
- 9, 4750 Covered Hoppers located off of various class 1s in multiple locations. End of Life.
- 5, 4750 Covered Hoppers located off of various class 1s in multiple locations. End of Life.
- 50, 31.8K Tank CPC 1232s located off of UP or BN in TX. Requal Due in 2025.
- 100, 4600CF Open Top Hoppers located off of BN or CSX in Southeast.
Call PFL today to discuss your needs and our availability and market reach. Whether you are looking to lease cars, lease out cars, buy cars, or sell cars call PFL today at 239-390-2885
Live Railcar Markets
| CAT | Type | Capacity | GRL | QTY | LOC | Class | Prev. Use | Offer | Note |
|---|
PFL will be at the Following Conferences
- Where: La Quinta, CA
- Attending: David Cohen (954-729-4774)
- Conference Website
- Where: Hyatt Regency Dallas in Dallas, TX
- Attending:Curtis Chandler (239.405.3365), David Cohen (954-729-4774), Brian Baker (239.297.4519), Cyndi Popov(403) 402-5043
- Conference Website
The post PFL Railcar Report 1-20-2026 appeared first on PFL Petroleum Services LTD.
]]>The post PFL Railcar Report 1-12-2026 appeared first on PFL Petroleum Services LTD.
]]>Jobs Update
- Initial jobless claims seasonally adjusted for the week ending January 3, 2026, came in at 208,000, versus the adjusted number of 200,000 people from the week prior, up 8,000 people week over week.
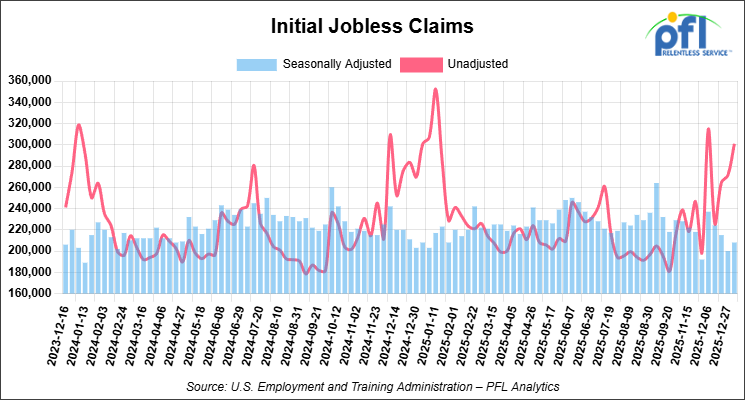
- Continuing jobless claims came in at 1,914,000, versus the adjusted number of 1,858,000 people from the week prior, up 56,000 week-over-week.
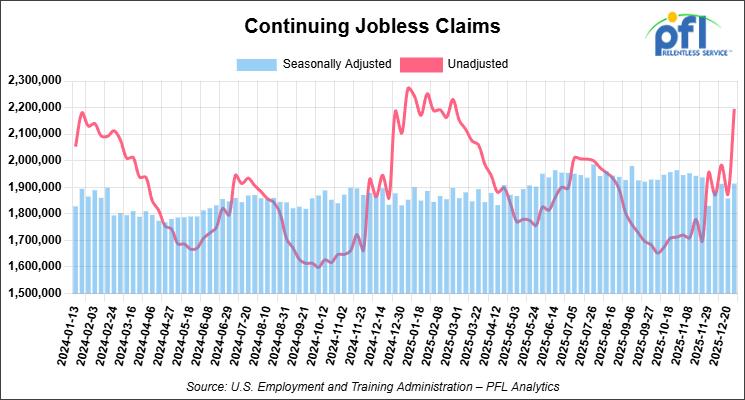
Stocks closed higher on Friday of last week and higher week-over-week
The DOW closed higher on Friday of last week, up 237.96 points (0.48%), closing out the week at 49,504.07, up 1,121.68 points week-over-week. The S&P 500 closed higher on Friday of last week, up 44.82 points (0.65%), and closed out the week at 6,966.28, up 107.81 points week-over-week. The NASDAQ closed higher on Friday of last week, up 191.33 points (0.81%), and closed out the week at 23,671.35, up 435.72 points week-over-week.
In overnight trading, DOW futures traded higher and are expected to open at 49,373 this morning, down 353 points from Friday’s close.
Crude oil closed higher on Friday of last week and higher week-over-week
West Texas Intermediate (WTI) crude closed up $1.36 per barrel (2.35%), to close at $59.12 on Friday of last week, up $1.80 cents per barrel week-over-week. Brent crude closed up $1.35 per barrel (2.18%), to close at $63.34, up $2.59 per barrel week-over-week.
One Exchange WCS (Western Canadian Select) for February delivery settled on Friday of last week at US$14.75 below the WTI-CMA (West Texas Intermediate – Calendar Month Average). The implied value was US$42.85 per barrel.
U.S. commercial crude oil inventories (excluding those in the Strategic Petroleum Reserve) decreased by 3.8 million barrels week-over-week. At 419.1 million barrels, U.S. crude oil inventories are 3% below the five-year average for this time of year.
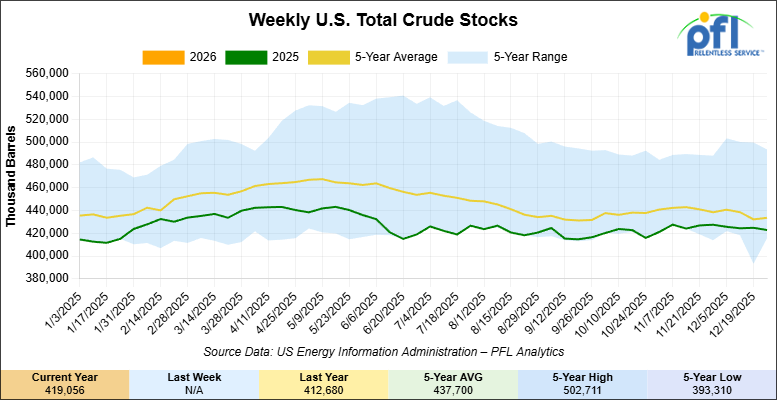
Total motor gasoline inventories increased by 7.7 million barrels week-over-week and are 3% above the five-year average for this time of year.
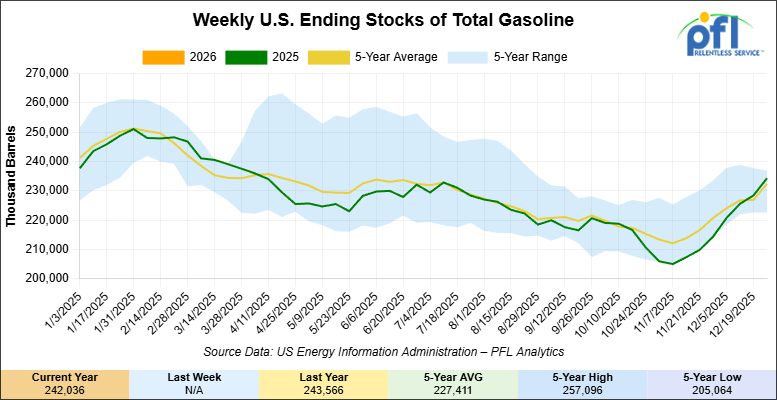
Distillate fuel inventories increased by 5.6 million barrels week-over-week and are 3% below the five-year average for this time of year.
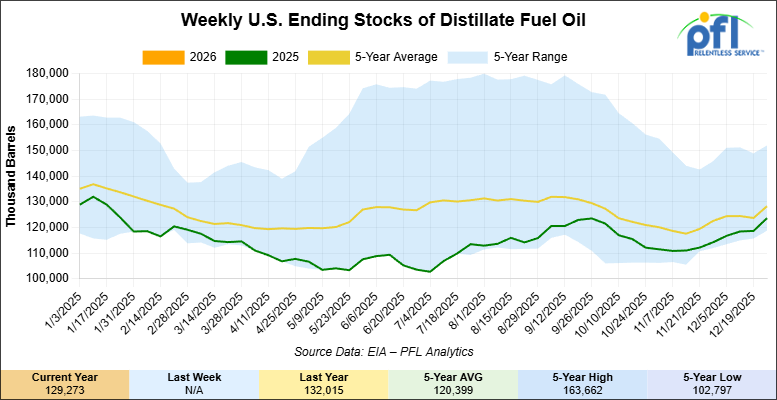
Propane/propylene inventories decreased 2.2 million barrels week–over-week and are 29% above the five-year average for this time of year.

Propane prices closed at 61.3 cents per gallon on Friday of last week, down 1.1 cents per gallon week-over-week, and down 25.5 cents year-over-year.
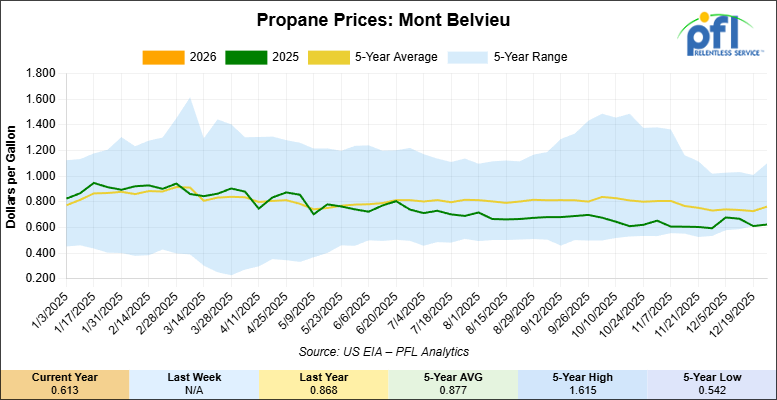
Overall, total commercial petroleum inventories increased by 8.1 million barrels week-over-week, during the week ending January 2, 2026.
U.S. crude oil imports averaged 6.3 million barrels per day during the week ending January 2, 2026, an increase of 1.4 million barrels per day week-over-week. Over the past four weeks, crude oil imports averaged 6 million barrels per day, 9.7% less than the same four-week period last year. Total motor gasoline imports (including both finished gasoline and gasoline blending components) averaged 549,000 barrels per day, and distillate fuel imports averaged 207,000 barrels per day during the week ending January 2, 2026.
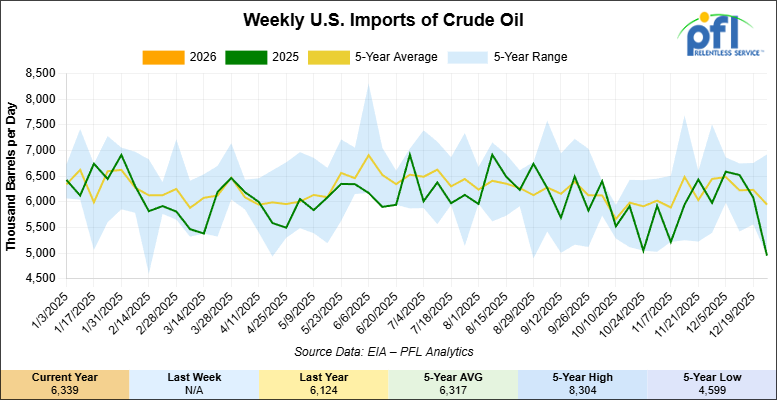
U.S. crude oil exports averaged 4.263 million barrels per day during the week ending January 7, 2026, an increase of 823,000 barrels per day week-over-week. Over the past four weeks, crude oil exports averaged 3.996 million barrels per day.

U.S. crude oil refinery inputs averaged 16.9 million barrels per day during the week ending January 2, 2026, which was 62,000 barrels per day more week-over-week.
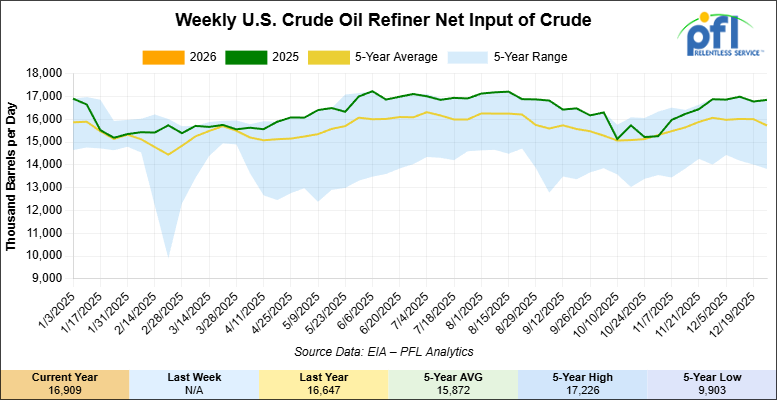
WTI futures are poised to open at $58.57, down $0.55 from Friday’s close.
North American Rail Traffic
Week Ending January 7, 2026
Total North American weekly rail volumes were up (+1.99%) in week 2, compared with the same week last year. Total Carloads for the week ending January 7, 2026 were 284,761, up (+4.38%) compared with the same week in 2024, while weekly Intermodal volume was 255,363, down (-0.54%) year over year. 5 of the AAR’s 11 major traffic categories posted year-over-year decreases. The largest decrease came from Motor Vehicles and Parts (-28.19%), while the largest increase was Coal (+23.56%).
In the East, CSX’s total volumes were up (+3.78%), with the largest decrease coming from Motor Vehicles and Parts (-35.24%), while the largest increase came from Grain (+36.10%). NS’s total volumes were up (+0.50%), with the largest increase coming from Petroleum & Petroleum Products (+50.54%), while the largest decrease came from Motor Vehicles and Parts (-31.61%).
In the West, BNSF’s total volumes were up (+6.16%), with the largest increase coming from Grain (+23.00%), while the largest decrease came from Motor Vehicles and Parts (-22.50%). UP’s total volumes were up (+1.50%), with the largest increase coming from Coal (+25.94%), while the largest decrease came from Motor Vehicles and Parts (-18.73%).
In Canada, CN’s total volumes were down (-1.93%), with the largest increase coming from Grain (+69.94%), while the largest decrease came from Motor Vehicles and Parts (-38.13%). CPKCS’s total volumes were down (-9.03%), with the largest increase coming from Coal (+62.52%), while the largest decrease came from Forest Products (-55.67%).
Source Data: AAR – PFL Analytics
North American Rig Count Summary
Rig Count
North American rig count was up by +94 rigs week-over-week. The U.S. rig count was down by -2 rigs week-over-week, and down by -40 rigs year-over-year. The U.S. currently has 544 active rigs. Canada’s rig count was up by +96 rigs week-over-week, but down by -19 rigs year-over-year. Canada currently has 197 active rigs. Overall, year-over-year we are down by -59 rigs collectively.
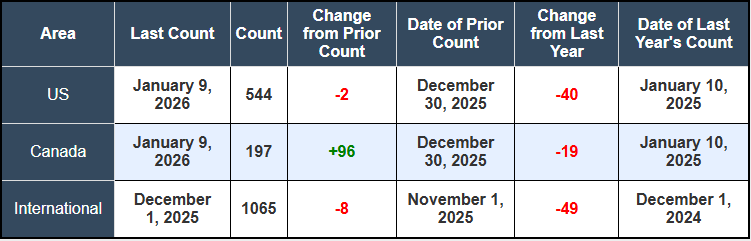
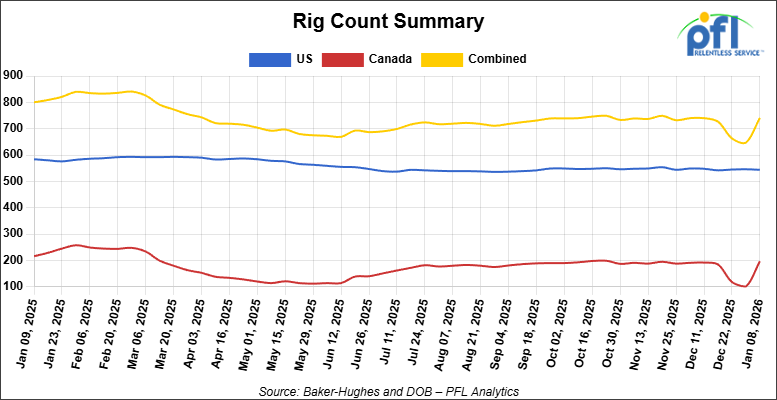
We are watching a few things out there for you:
We are Watching Petroleum Carloads
The four-week rolling average of petroleum carloads carried on the six largest North American railroads fell to 28,391 from 29,082, which was a decrease of -691 rail cars week-over-week. Canadian volumes were higher. CPKC’s shipments were higher by +9.0% week-over-week, CN’s volumes were higher by +8.0% week-over-week. U.S. shipments were mostly higher. The NS had the largest percentage increase and was up by +22.0%. The BNSF was the sole decliner and was down by -3.0%.
We are Watching Geopolitical Oil Risk
Crude markets face renewed supply uncertainty last week as large-scale protests continued in Iran last week affecting its economy and the energy sector. Large demonstrations -the most significant since 2009 – have forced shutdowns of petrochemical plants due to gas supply shortages, and the Iranian Rial has collapsed to record lows at 1.47 million to the dollar.
President Trump issued direct warnings that the Iranian regime will “pay hell” if protesters are killed, injecting geopolitical risk premium into the market. With Iran producing more than three million barrels per day, disruption concerns are legitimate. Options market trading in crude futures shows call skew at its highest level since June, indicating traders are actively hedging against sudden price spikes.
West Texas Intermediate closed the week at $59.12 per barrel, up $1.80 from the prior week and Brent futures closed over $63 per barrel on the back of the continued pretests. Geopolitical volatility sustains the premium valuations currently embedded in long-haul transportation rates, particularly on longer-duration Canadian crude movements where hedging via alternative logistics gains value during uncertain periods.
We are Watching the SPR
The Trump Administration is pursuing an unconventional path to replenish the Strategic Petroleum Reserve without direct congressional appropriations. At the Goldman Sachs Energy Conference on Tuesday of last week, U.S. Energy Secretary Chris Wright disclosed plans to negotiate deals with private oil companies that would generate crude barrels and route them into SPR storage without requiring any government cash outlay.
The current SPR holds approximately 401 million barrels – roughly 60 percent of designed capacity.
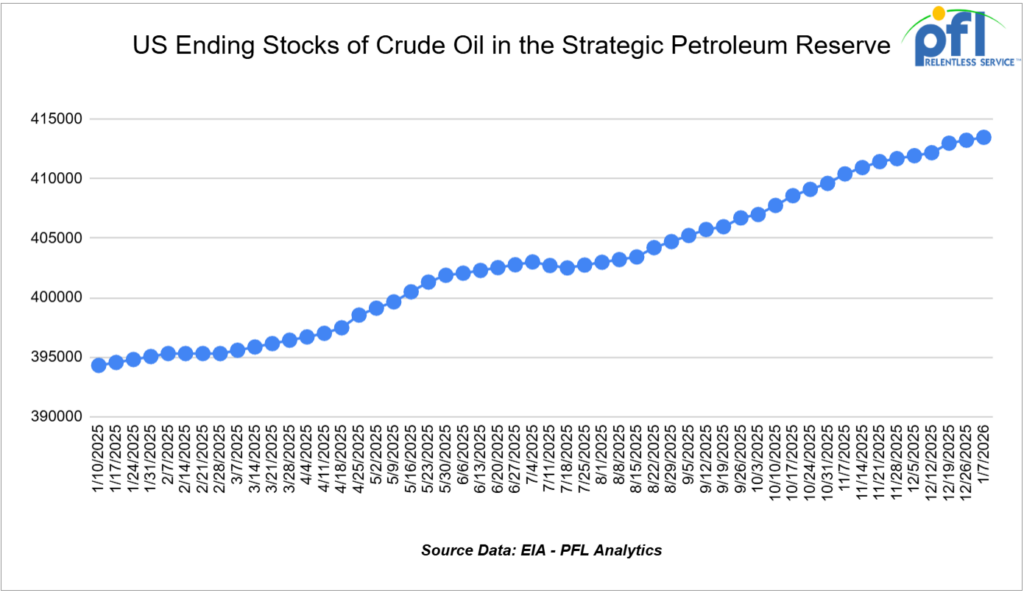
Achieving Trump’s stated goal of filling the reserve “right to the top” would require acquiring an additional 280 million barrels, at an estimated cost exceeding $16 billion at current market prices. The administration indicated that additional details regarding the oil acquisition program will be released within the next year.
A SPR Reserve in Freeport, Texas
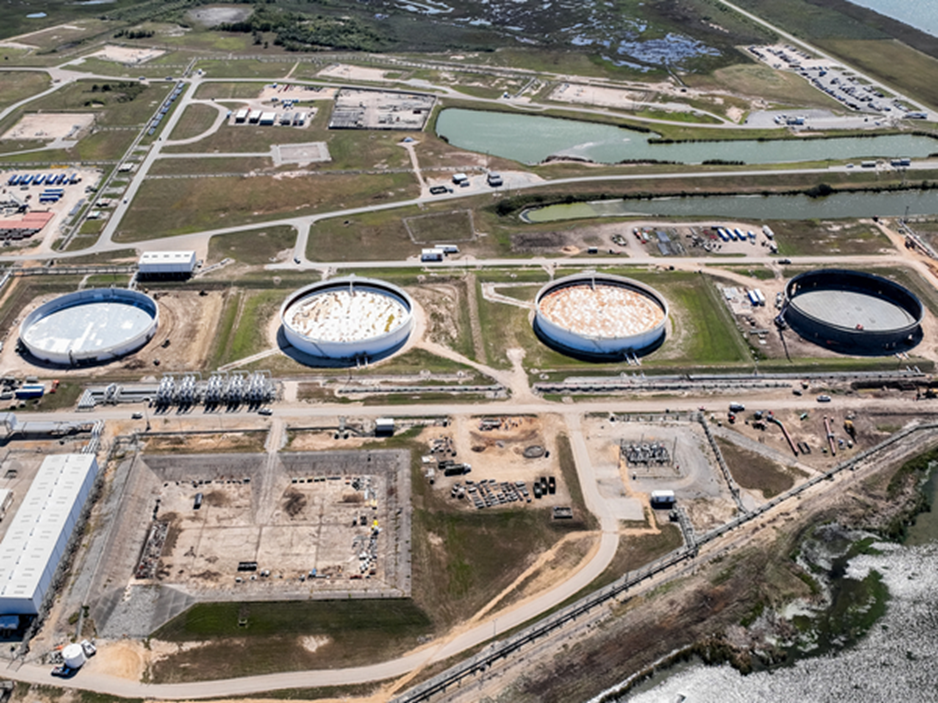
Source: EIA – PFL Analytics
The Treasury has one formal mechanism already in motion: Congress allocated $171 million last year (a reduction from an initial $1.3 billion proposal) to purchase crude for SPR. Additionally, oil companies have committed to returning 13 million barrels of long-term crude loans to the SPR by year-end. These routine purchases alone will bring SPR levels up only modestly, leaving the reserve at approximately 60 percent capacity even after all current commitments are fulfilled.
The administration’s preference for “creative” structures echoes historical precedent. Former President George W. Bush in 2001 created a royalty-in-kind program where U.S. Gulf producers paid government royalties in the form of oil delivered directly to SPR. That program operated until 2009 when the Department of Energy identified improper relationships between program staff and oil industry employees. The Trump Administration’s model will likely differ in structure, but serves the same objective: bypassing appropriations gridlock while increasing strategic inventory.
SPR refill activity, regardless of mechanism, supports sustained demand for crude logistics and potentially incentivizes new crude-by-rail movements if producers take advantage of favorable pricing windows to book SPR deliveries.
We are Watching Alberta
Alberta last week launched a centralized project hub tied to a proposed oil pipeline to Canada’s northwest coast, signaling renewed provincial interest in export diversification beyond existing U.S.-bound infrastructure. The hub’s stated objective is to align early technical work and move toward a formal federal project submission by mid-2026.
Critical caveats accompany the announcement. There is no approved route, no construction start date, and no committed shipper volumes. The initiative is structured as private-sector-led with the government playing a facilitation role rather than a capital provider or operator. Projects of this scale and regulatory complexity involving Indigenous consultation, environmental review, potential court challenges, and multi-year permitting routinely require a decade or longer to advance from the conceptual stage to operation.
The pipeline’s strategic logic is compelling. Western Canadian crude production continues to grow alongside recent pipeline expansions, however takeaway capacity relative to production tightens quickly when crude prices strengthen or refining demand rebounds. Existing systems run at full capacity faster than expected, exposing producers to pricing discounts and logistics congestion risk. A northwest coast pipeline would eventually provide a direct outlet to Pacific refining centers and Asian markets, reducing reliance on a single export path and enhancing producer optionality.
The multi-year lag between project initiation and operation directly sustains crude-by-rail demand. Historical precedent demonstrates that when pipeline capacity lags production growth, rail volumes do not vanish; they remain steady or increase as shippers seek flexibility and market access. Canadian Producers have shown they do not slow crude output while infrastructure sits in planning stages. Instead, storage, staging, and rail movements become strategic tools, not backup plans. During the pipeline’s approval and construction timeline, rail remains the only transportation mode capable of scaling quickly (subject to rail car availability) without new environmental or regulatory permits.
At least for now, from a U.S. perspective, the extended infrastructure timeline in Alberta supports continued cross-border crude rail movements into U.S. Gulf Coast and Midwest refineries.
We are Watching Crude Transportation Rates
Petroleum Transportation rates remained relatively stable last week, with modest pressure from lower crude prices balancing against supply tightness in select regions.
Canadian Crude-by-Rail: Rates from Alberta to the U.S. Gulf Coast held steady at $15.39 per barrel, unchanged week over week, indicating stable logistics costs despite near-term price volatility. Western Canadian Select crude at Hardisty posted a $14.75 per barrel discount to CMA Nymex, approximately $2.35 wider than a month earlier. This discount widening reflects tightening pipeline capacity from Alberta combined with seasonal demand softness coupled with higher production possibly creating opportunities for producers to examine rail optionality when price differentials favor incremental transportation cost.
Trans Mountain Pipeline and Pacific Movements: The 890,000 barrel-per-day Trans Mountain system accepted all January nominations from shippers, yet the expanded system continues to operate below full capacity. Market participants noted softer demand from Asia-Pacific for Canadian heavy crude during the January trading cycle, partly reflecting the absence of major Shandong refiner Yulong, which has ceased operations. Yulong previously purchased three to five cargo lots of the approximately 25 heavy crude shipments exported monthly.
Refined Products and Market Structure: U.S. Gulf Coast medium-range tanker spot rates rose to their highest level in over one month following the holiday season, as market participants positioned for Q1 maintenance season within the Gulf refining complex. U.S. Gulf Coast refinery utilization reached 98.6 percent on January 2nd- the highest level since June 2023 – but historical data indicate utilization typically drops 20 percentage points between early and late February as seasonal maintenance begins.
We are Watching Trans-Pacific Container Shipping
Container rates on major trans-Pacific trade lanes strengthened significantly last week, with carriers’ general rate increases taking effect and pre-Lunar New Year demand supporting pricing resilience.
Eastbound trans-Pacific rates (China-U.S. West Coast) increased 22%to $2,617 per forty-foot equivalent unit and are now more than 30%higher than mid-December levels. East Coast rates climbed 12% to $3,757 per FEU after a 20% gain month over month.
The rate recovery reflects shippers positioning inventory ahead of the Lunar New Year holiday in mid-February, when Chinese factories close for several weeks. Unlike several general rate increase attempts during Q4 of 2025, which subsequently retreated as the market tested pricing, current GRI levels have held firm, suggesting that underlying demand is supporting higher rate structure.
Asia-Europe and Asia-Mediterranean rates also posted significant gains, with Mediterranean prices increasing 20 percent to $4,800 per FEU and rising 23 to 45 percent since mid-December. While ample retail inventories in the U.S. are expected to temper January volumes approximately 10% below year-ago levels, ongoing capacity additions among ocean carriers are forecast to weaken trans-Pacific rates year-on-year, despite seasonal strength.
We are Watching the STB
In a significant deregulation move, the Surface Transportation Board announced on Thursday of last week a proposed rulemaking that would fundamentally reshape rail competition and shipper access. The unanimous decision calls for repealing 49 C.F.R. part 1144, which has governed reciprocal switching restrictions since 2001.
The current framework has proven exceptionally rigid. Under existing regulations, no rail customer has ever successfully obtained reciprocal switching, a stark indicator that regulatory barriers have effectively blocked competitive options. The proposed NPRM would replace prescriptive rules with case-by-case STB review, allowing shippers to petition for access to secondary carriers at nearby rail interchange points where geographic or operational feasibility exists.
STB Chairman Patrick Fuchs framed the initiative as alignment with statutory intent and market principles: “This proposal would embrace market forces, enable meaningful choice for American businesses as provided under the statutes, and eliminate regulatory barriers unnecessarily stifling rail competition.” The rule change flows from the Department of Justice’s Anticompetitive Regulations Task Force, established in March 2025 following Executive Order 14192.
The American Chemistry Council, a major freight shipper constituency, strongly praised the proposal. ACC officials noted that reciprocal switching provides captive shippers – those served by a single railroad with no practical alternative – access to competitive service options at interchanges. The council explicitly stated that current restrictions have “failed” and that case-specific review offers genuine competitive relief.
Comment periods are tight. Interested parties must submit comments by March 10th and reply comments by April 24th. If reciprocal switching becomes viable, shippers gain leverage to negotiate alternative routing for refined products and specialty chemicals, potentially fragmenting long-haul unit train movements into smaller, multi-carrier shipments. Simultaneously, expanded competitive access may pressure per-car lease rates on commodity routes while supporting premium pricing on specialized services where single-carrier operation remains optimal.
We are Watching Canadian Grain
Canadian National reported on Thursday of last week that December 2025 grain movements set a new monthly record, continuing an unprecedented streak. CN transported 2.82 million metric tonnes of grain from Western Canada in December alone, exceeding the previous December 2020 record by 80,000 tonnes.
The full-year 2025 performance was equally noteworthy. CN moved 31.3 million metric tonnes from Western Canada during 2025, surpassing the previous annual record. When including Eastern Canadian grain, CN’s total 2025 grain movement reached 32.7 million metric tonnes, breaking 2024’s previous all-time record of 32.25 million tonnes.
The streak represents four consecutive monthly records and reflects robust harvest conditions, strong export demand, and improved rail operating efficiency. The performance highlights the resilience of rail logistics during periods of sustained commodity supply and export opportunity, contrasting with the softer intermodal and automotive environments that pressured overall traffic in late 2025.
We are Watching the Howard Street Tunnel
CSX announced on January 9th the completion of final paving on the Guilford Avenue Bridge in Baltimore, marking a major milestone in the Howard Street Tunnel modernization project. The historic tunnel, originally constructed in 1895, has been the bottleneck limiting East Coast double-stack intermodal train movements for decades.
CSX finished the tunnel expansion itself in September 2025. The bridge paving work immediately following completion eliminated a critical height constraint. The expanded vertical clearance now permits double-stack intermodal trains to transit the tunnel smoothly, dramatically improving freight efficiency for the Port of Baltimore, regional intermodal operators, and shippers requiring East Coast rail access.
Howard Street Tunnel
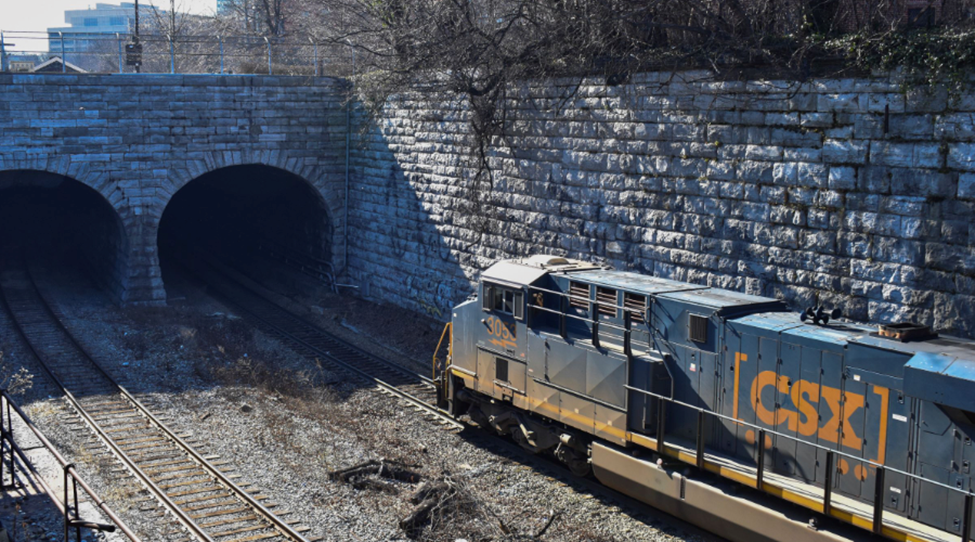
Source: CSX – PFL Analytics
The phased completion strategy “allowed us to avoid major disruptions and keep the project on track for the community and our customers.” The infrastructure investment positions Baltimore as a more competitive gateway for international container movements and domestic intermodal service relative to competing East Coast ports and rail hubs.
Additionally, CSX was named to the CDP “A” List for climate leadership on January 9th, regaining its top climate disclosure score after two years at the B level. CSX is the only Class I railroad to earn this 2026 distinction, placing the company among global environmental leaders in governance and transparency.
The Howard Street milestone represents incremental capacity improvement for competing intermodal and automotive traffic, which can marginally reduce congestion and improve velocity on East Coast rail corridors. The primary impact is on containerized and automotive freight, rather than petroleum logistics, which predominantly flow via unit train and dedicated tank car corridors.
We are watching Key Economic Indicators
Unemployment Rate
On January 9, 2026, the BLS reported that a preliminary 50,000 net new jobs were created in December 2025. Figures for prior months remain weak, with job gains showing little net change over recent months.
According to the BLS, 2025’s net new job gains have totaled 584,000. The official unemployment rate was 4.4% in December, down slightly month over month.
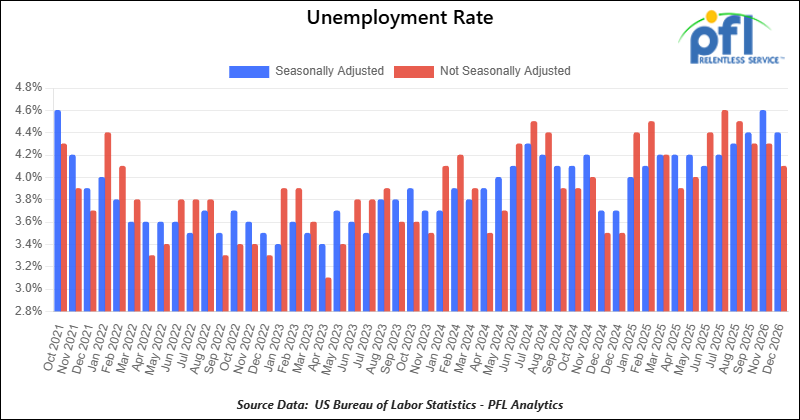
Purchasing Managers Index (PMI)
The Institute for Supply Management releases two PMI reports – one covering manufacturing and the other covering services. These reports are based on surveys of supply managers across the country and track changes in business activity. A reading above 50% on the index indicates expansion, while a reading below 50% signifies contraction, with a faster pace of change the farther the reading is from 50.
The Manufacturing PMI in December was 47.9%, down from 48.2% in November. This remains in contraction territory, marking the tenth straight month below 50%. On the Services PMI side, the most recent reading is 54.4% (December), up from 52.6% in November, signaling continued expansion in the services sector.
Lease Bids
- 30-50, 6000cf Steel Hopper located off of CSX or NS in East. For use in petcoke service. Period: 5 Years.
- 10, 2500CF Open Top Hopper located off of UP or BN in Texas. For use in aggregate service. Period: 5 years. Need Rapid Discharge Doors.
- 100, 21.9K 117J Tank located off of All Class 1s in Midwest. For use in CO2 service. Period: 6 months.
- 30-50, 30K 117J Tank located off of NS or CSX in Northeast. For use in C5 service. Period: 1 year.
- 60, 33K 340W Tank located off of BNSF in UT/AZ. For use in Propane service. Period: Trip Lease.
Sales Bids
- 28, 3400CF Hopper Covered located off of UP BN in Texas. For use in Cement service.Cement Gates needed.
- 20, 17K Tank DOT111 located off of various class 1s in various locations. For use in corn syrup service.
- 120, Various Gondola Open-Top Aluminum Rotary located off of various class 1s in various locations. For use in Sulphur service.Built 2004 or later.
- 30, 29K Tank DOT111 located off of various class 1s in Chicago. For use in Veg Oil service.
Lease Offers
- 100, 30K CPC1232 Tanks located off of UP or BN in Texas. Last used in Diesel.
- 100, 30K DOT117J Tanks located off of UP or BN in Texas. Last used in Gasoline.
- 100, 29K DOT117J Tanks located off of UP or BN in Texas. Last used in Gasoline. Coiled and Insulated.
- 36, 6351 Covered Hopper located off of CN in Wisconsin. Last used in Grain. through 2/27.
- 29, 6580 Covered Hopper located off of CN in Wisconsin. Last used in Grain. through 2/26.
- 18, 6580 Covered Hopper located off of CN in Wisconsin. Last used in Grain. through 2/27.
- 9, 5400 Covered Hopper located off of CN in Wisconsin. Last used in Grain. through 2/27.
- 21, 6351 Covered Hopper located off of CN in Wisconsin. Last used in DDG. Available until February 2027.
- 29, 6500 Covered Hopper located off of CN in Wisconsin. Last used in DDG. Available until February 2027.
- 50, 5380 Covered Hopper located off of UP or BN in Houston. Last used in Fertilizer. Cars are currently clean. Available until February.
- 50, 20K DOT117J Tank located off of All Class 1s in Moving. Last used in Styrene.
- 29, 25.5K DOT117J Tank located off of UP or BN in Texas. Cars are currently clean. Cars are currently clean.
- 90, 30K DOT117J Tank located off of UP or BN in Corpus Christie. Last used in Diesel.
Sales Offers
- 21, 50′ Boxcar Plate Cs located off of various class 1s in NM. End of Life.
- 3, 50′ Boxcar Plate Cs located off of various class 1s in multiple locations. End of Life.
- 27, 50′ Boxcar Plate Cs located off of various class 1s in PQ. End of Life.
- 100, 3250 Covered Hoppers located off of various class 1s in multiple locations. Sand Cars.
- 5, 2740 Mill Gondolas located off of various class 1s in NC. End of Life.
- 1, 2260 Mill Gondolas located off of various class 1s in AL. End of Life.
- 30, 2740 Mill Gondolas located off of various class 1s in multiple locations. End of Life.
- 21, 2740 Mill Gondolas located off of various class 1s in WA. End of Life.
- 9, 4750 Covered Hoppers located off of various class 1s in multiple locations. End of Life.
- 5, 4750 Covered Hoppers located off of various class 1s in multiple locations. End of Life.
- 50, 31.8K Tank CPC 1232s located off of UP or BN in TX. Requal Due in 2025.
- 100, 4600CF Open Top Hoppers located off of BN or CSX in Southeast. N/A.
Call PFL today to discuss your needs and our availability and market reach. Whether you are looking to lease cars, lease out cars, buy cars, or sell cars call PFL today at 239-390-2885
Live Railcar Markets
| CAT | Type | Capacity | GRL | QTY | LOC | Class | Prev. Use | Offer | Note |
|---|
PFL will be at the Following Conferences
- Where: La Quinta, CA
- Attending: David Cohen (954-729-4774)
- Conference Website
- Where: Hyatt Regency Dallas in Dallas, TX
- Attending:Curtis Chandler (239.405.3365), David Cohen (954-729-4774), Brian Baker (239.297.4519), Cyndi Popov(403) 402-5043
- Conference Website
The post PFL Railcar Report 1-12-2026 appeared first on PFL Petroleum Services LTD.
]]>The post PFL Railcar Report 1-5-2026 appeared first on PFL Petroleum Services LTD.
]]>Jobs Update
- Initial jobless claims seasonally adjusted for the week ending December 27, 2025 came in at 199,000, versus the adjusted number of 215,000 people from the week prior, down 16,000 people week over week.
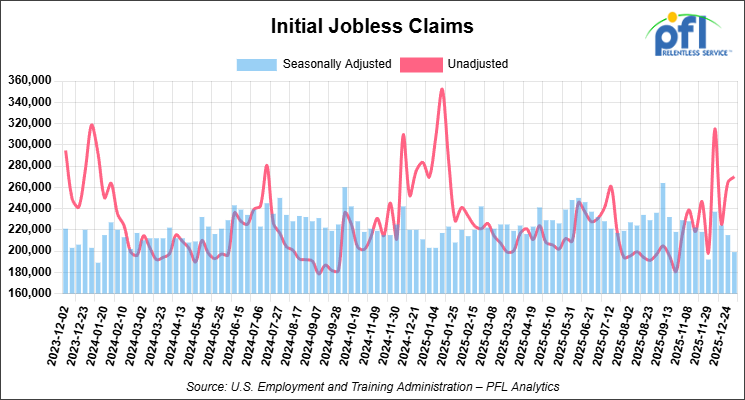
- Continuing jobless claims came in at 1,866,000, versus the adjusted number of 1,913,000 people from the week prior, down 47,000 week-over-week.
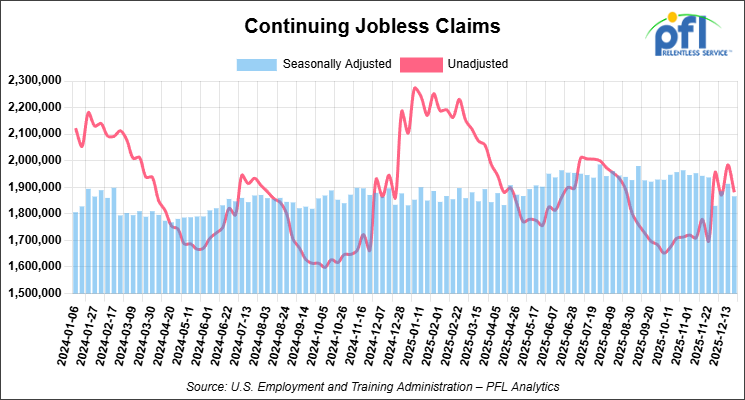
Stocks closed mixed on Friday of last week, but lower week-over-week
The DOW closed higher on Friday of last week, up 319.10 points (0.66%), closing out the week at 48,382.39, down -328.58 points week-over-week. The S&P 500 closed higher on Friday of last week, up 12.97 points (0.19%), and closed out the week at 6,858.47, down -71.47 points week-over-week. The NASDAQ closed lower on Friday of last week, down -6.36 points (-0.03%), and closed out the week at 23,235.63, down -357.47 points week-over-week.
In overnight trading, DOW futures traded higher and are expected to open at 48,641 this morning, up 25 points from Friday’s close.
Crude oil closed lower on Friday of last week, but higher week-over-week
West Texas Intermediate (WTI) crude closed down -0.10 per barrel, to close at $57.32 on Friday of last week, but up $0.58 week-over-week. Brent crude closed down -0.10 per barrel, to close at $60.75, but up $0.11 week-over-week.
One Exchange WCS (Western Canadian Select) for February delivery settled on Friday of last week at US$13.10 below the WTI-CMA (West Texas Intermediate – Calendar Month Average). The implied value was US$44.22 per barrel.
U.S. commercial crude oil inventories (excluding those in the Strategic Petroleum Reserve) decreased by 1.9 million barrels week-over-week. At 422.9 million barrels, U.S. crude oil inventories are 3% below the five-year average for this time of year.
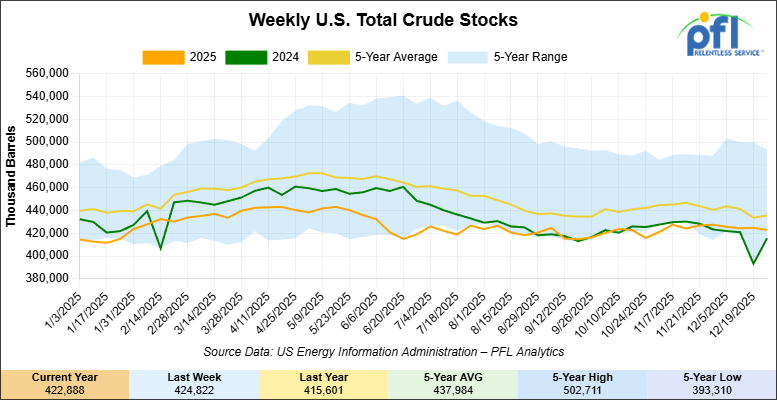
Total motor gasoline inventories increased by 5.8 million barrels week-over-week and are 2% above the five-year average for this time of year.
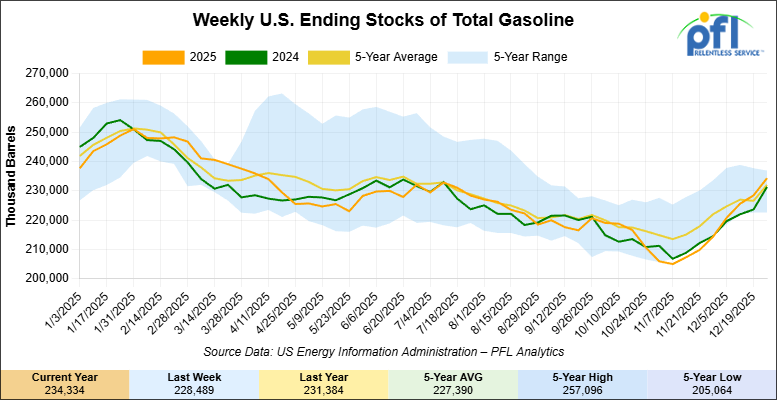
Distillate fuel inventories increased by 5 million barrels week-over-week and are 4% below the five-year average for this time of year.
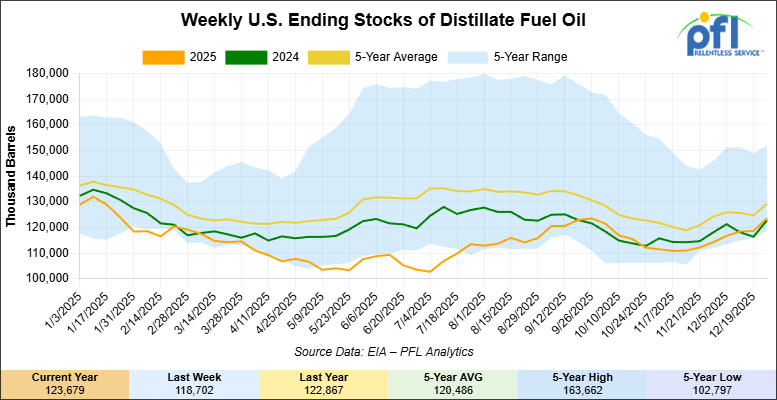
Propane/propylene inventories increased 800,000 thousand barrels week-over-week and are 27% above the five-year average for this time of year.
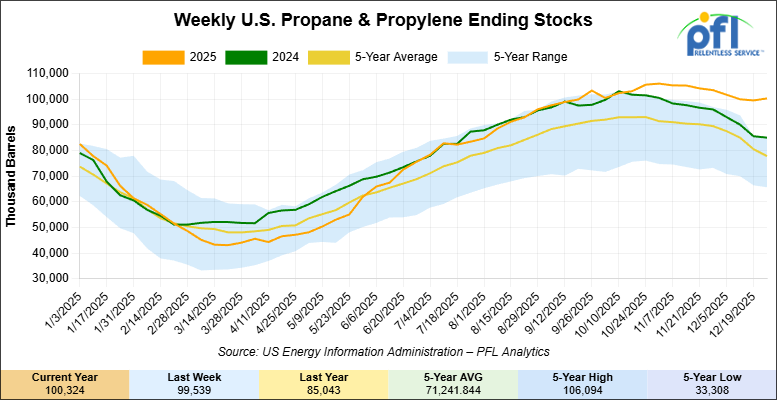
Propane prices closed at 62.4 cents per gallon on Friday of last week, up 1.2 cents per gallon week-over-week, but down 14.2 cents year-over-year.

Overall, total commercial petroleum inventories increased by 10.2 million barrels week-over-week, during the week ending December 26, 2025.
U.S. crude oil imports averaged 5 million barrels per day during the week ending December 26, 2025, a decrease of 1.1 million barrels per day week-over-week. Over the past four weeks, crude oil imports averaged 6 million barrels per day, 7.2% less than the same four-week period last year. Total motor gasoline imports (including both finished gasoline and gasoline blending components) averaged 525,000 barrels per day, and distillate fuel imports averaged 283,000 barrels per day during the week ending December 26, 2025.
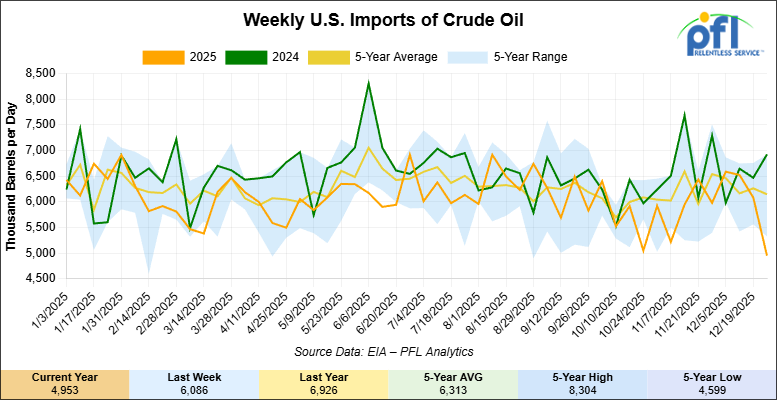
U.S. crude oil exports averaged 3.44 million barrels per day during the week ending December 26, 2025, a decrease of 176,000 barrels per day week-over-week. Over the past four weeks, crude oil exports averaged 3.932 million barrels per day.
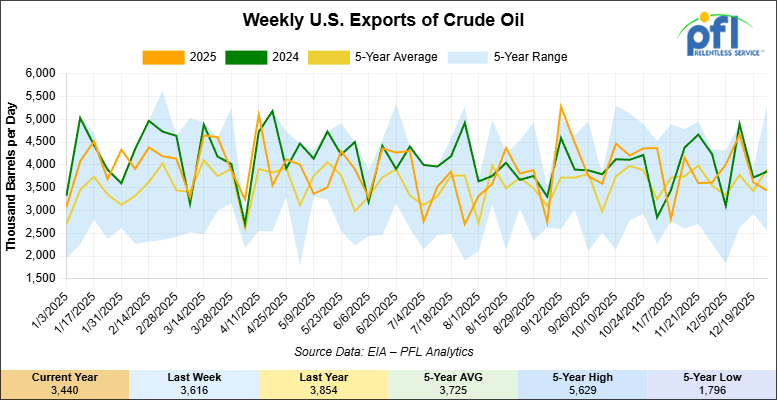
U.S. crude oil refinery inputs averaged 16.8 million barrels per day during the week ending December 26, 2025, which was 71,000 barrels per day more week-over-week.

WTI futures are poised to open at $57.59, up $0.27 from Friday’s close.
North American Rail Traffic
Week Ending December 24, 2025:
Total North American weekly rail volumes were down (-6.27%) in week 52, compared with the same week last year. Total Carloads for the week ending December 24, 2025 were 309,912, down (-6.38%) compared with the same week in 2024, while weekly Intermodal volume was 337,363, down (-6.17%) year over year. 9 of the AAR’s 11 major traffic categories posted year-over-year decreases. The largest decrease came from Forest Products (-19.81%), while the largest increase was Other (+1.15%).
In the East, CSX’s total volumes were down (-3.40%), with the largest decrease coming from Grain (-22.14%), while the largest increase came from Other (+9.16%). NS’s total volumes were down (-5.34%), with the largest increase coming from Petroleum & Petroleum Products (+5.68%), while the largest decrease came from Nonmetallic Minerals (-15.32%).
In the West, BNSF’s total volumes were down (-3.39%), with the largest increase coming from Coal (+61.83%), while the largest decrease came from Chemicals (-21.19%). UP’s total volumes were down (-8.01%), with the largest increase coming from Grain (+9.26%), while the largest decrease came from Coal (-36.06%).
In Canada, CN’s total volumes were down (-4.90%), with the largest increase coming from Other (+73.46%), while the largest decrease came from Intermodal Units (-15.57%). CPKCS’s total volumes were down (-26.43%), with the largest increase coming from Coal (+17.73%), while the largest decrease came from Forest Products (-66.75%).
Source Data: AAR – PFL Analytics
North American Rig Count Summary
Rig Count
North American rig count was down by -16 rigs week-over-week. The U.S. rig count was up by +1 rig week-over-week, and down by -43 rigs year-over-year. The U.S. currently has 546 active rigs. Canada’s rig count was down by -17 rigs week-over-week but up by +7 rigs year-over-year. Canada currently has 101 active rigs. Overall, year-over-year we are down by -36 rigs collectively.
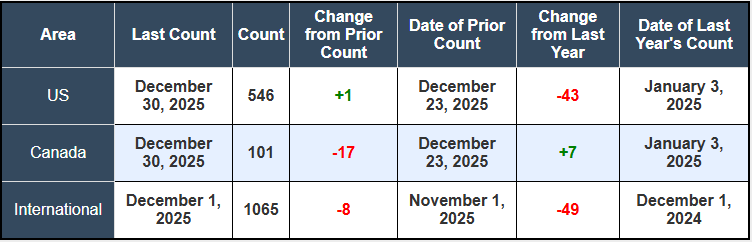
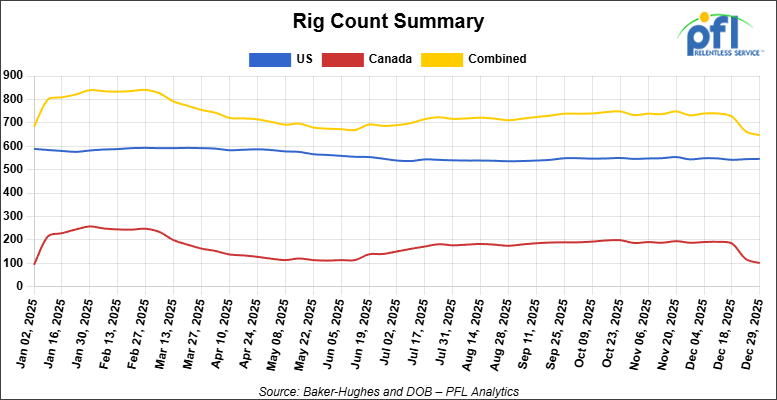
We are watching a few things out there for you:
We are watching Venezuela
In a stunning overnight operation that shocked global markets and reshaped the Western Hemisphere’s political landscape, U.S. Special Forces conducted an incursion into Venezuela early Saturday morning, January 3, capturing President Nicolás Maduro and his wife Cilia Flores at their residence within Fort Tiuna military installation in Caracas and flying them out of the country to face narco-terrorism charges in New York federal court.
President Trump announced the capture on social media around 4:30 a.m. ET Saturday, declaring that U.S. forces had successfully extracted Maduro after what he characterized as an extraordinary display of military precision. Speaking to Fox News later Saturday, Trump said he had watched the operation in real time and stated he had “never seen anything like it,” describing how U.S. commandos breached reinforced steel doors at the Fort Tiuna compound “in a matter of seconds.” The operation involved at least seven major airstrikes across Caracas and surrounding regions, with low-flying aircraft visible to residents around 2 a.m. local time. Trump confirmed that some U.S. forces sustained injuries, but reported no deaths.
For tank car operators and North American crude markets, the long-term market implications could be substantial. Venezuela holds the world’s largest proven crude oil reserves, but has seen production and exports collapse under Maduro’s mismanagement and escalating U.S. sanctions enforcement, falling from roughly 3 million barrels per day in 2012 to approximately 1.1 million bpd by late 2025. The Trump Administration stepped up tanker sanctions enforcement in December, seizing the crude tanker Merlin on December 10 and declaring an effective blockade on Venezuelan exports on December 16, cutting deliveries roughly in half from November levels.
World Reserves
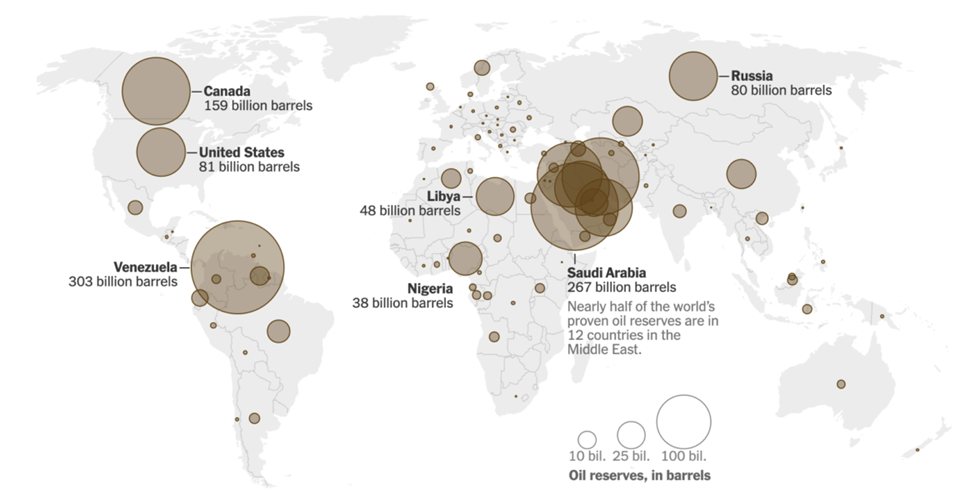
Source: The New York Times Oil and Gas Journal – PFL Analytics
The immediate aftermath of Maduro’s capture shows a Venezuelan government apparatus in complete disarray. State oil company PDVSA’s command structure is unclear, and the country faces potential refugee flows as border security collapses. In the short term, Venezuelan crude exports will likely collapse further as tanker operators face legal and operational uncertainty and as potential transitional authorities assess the status of the country’s oil infrastructure.
This tightens the global heavy sour market sharply over the next 60-90 days, creating concrete upside for North American crude-by-rail economics. Canadian heavy crude rail rates from Alberta to the U.S. Gulf Coast are approximately $15.00 per barrel. At Hardisty, Alberta, Western Canadian Select’s discount to the CMA Nymex widened to $13.05 per barrel – 70 cents wider than a month earlier—reflecting robust Canadian production meeting pipeline constraints and rail optionality. With Venezuelan medium sour supplies tightening and U.S. Gulf Coast domestic sour production surging (spot trading of Southern Green Canyon crude hit a record 300,000 b/d in December 2025, the largest monthly volume since the assessment launched in 2006), refiners dependent on heavy crude have limited alternatives beyond Canadian heavy in the short term.
U.S. Gulf Coast refiners who have relied on Venezuelan heavy crude will be forced to source alternatives over the next 60-90 days—predominantly Canadian heavy, Mexican Maya, or Middle Eastern crudes. This creates incremental demand for North American rail movements and potential utilization support for existing crude tank car fleets. The economic case for Canadian crude-by-rail strengthens materially when pipeline capacity to the Gulf Coast is constrained and Canadian heavy discounts widen relative to delivered alternatives.
The medium-term outcomes depend entirely on whether a stable transitional government emerges and whether the Trump administration moves toward sanctions relief. Venezuelan opposition leader Edmundo González, recognized by the U.S. as the legitimate election winner, could theoretically form a transitional government relatively quickly, although this was dismissed by Trump over the weekend saying she does not have the respect of the people. If sanctions are lifted over the coming months and foreign investment resumes, Venezuelan production could ramp toward 1.5-2.0 million bpd over in short order as Chevron, international NOCs, and service companies return. That scenario would add substantial seaborne heavy crude supply back to global markets, eventually softening WCS differentials and reducing Canadian crude-by-rail shipments.
An additional complicating factor: the shift in Canadian crude flows toward Asia. Approximately 66%of heavy Canadian crude exports from the Trans Mountain pipeline system were destined to Asia-Pacific year-to-date November 2025, up from a 60:40 split in the second half of 2024. This shift accelerated following West Coast refinery closures—Phillips 66 shuttered its 139,000 b/d Los Angeles refinery on October 16, and Valero is planning to close its 145,000 b/d Benicia refinery near San Francisco by April 2026. Those three refineries represented 23% of California’s refinery capacity and combined took 30,000 b/d of Cold Lake crude in the first half of 2025. For PFL’s customers, the takeaway is that short-term Venezuelan supply tightness supports crude-by-rail margins from Western Canada, but the structural shift of Canadian crude toward Asian tanker movements could limit the upside of those economics if Asia-bound exports continue growing at the expense of U.S. Gulf Coast rail movements.
For now, Venezuelan regime change has created a near-term tightening in heavy crude supply that benefits crude-by-rail economics from Western Canada, while longer-term outcomes remain dependent on how quickly a stable transitional government consolidates control and whether sanctions are normalized. The next 30 days will be critical in determining whether continued Venezuelan supply collapse or rapid normalization becomes the base case for 2026 energy markets and rail transportation demand. Stay tuned to PFL, we are watching this one closely,
We are watching Petroleum Carloads
The four-week rolling average of petroleum carloads carried on the six largest North American railroads fell to 29,082 from 29,740, which was a decrease of +658 rail cars week-over-week. Canadian volumes were lower. CPKC’s shipments were lower by -18.0% week-over-week, CN’s volumes were lower by -22..0% week-over-week. U.S. shipments were mixed. The BNSF had the largest percentage increase and was up by +1.0%. The CSX had the largest percentage decrease and was down by -17%.
We were watching a Train Derailment in Kentucky
In case you missed it, a CSX freight train derailed on December 29th in rural Todd County, Kentucky and sent 31 cars off the tracks near the Tennessee border, with at least one tank car carrying molten sulfur that leaked and sparked a fire—triggering emergency response measures and temporary evacuation orders that remained in effect through the weekend. The incident occurred just after 6:15 a.m. local time near Trenton, a community of approximately 350 residents located 55 miles northwest of Nashville. While no injuries were reported and air quality testing confirmed acceptable conditions after the fire was extinguished, the derailment serves as a stark reminder of hazmat transport risks and the critical importance of emergency preparedness infrastructure.
Kentucky Train Derailment
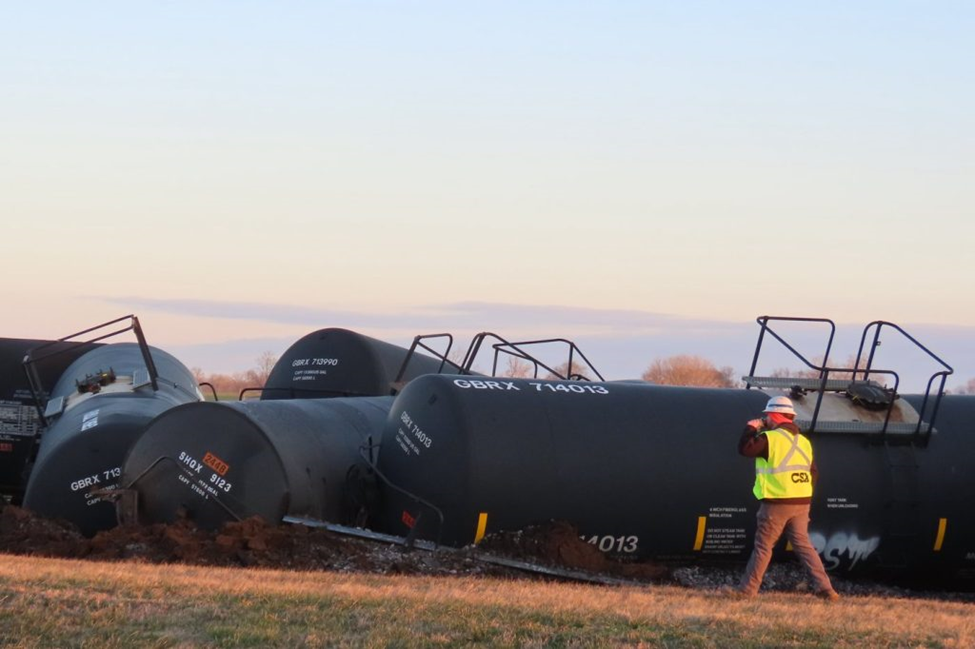
Source: WEKT via AP – PFL Analytics
We are watching the NS and the UP merger
The proposed Union Pacific–Norfolk Southern merger has officially entered the “gloves-off” phase. Following the December 19th filing of a massive seven thousand (7,000) page application, the industry’s response was swift and overwhelmingly negative. By the December 29th deadline, a “who’s who” of Class I railroads—including BNSF, CSX, CN, and CPKC—filed formal comments urging the Surface Transportation Board (STB) to reject the deal.
The opposition isn’t just complaining about competition; they are attacking the technical merits of the application itself. Rival carriers identified several “deficiencies,” claiming the filing omitted key data on truck diversion, failed to include essential appendices of the merger agreement, and provided an “incomplete” network map that glosses over overlapping lines. BNSF was particularly blunt, stating the application only “superficially grapples” with the economic risks involved.
While UP and NS filed a rebuttal on January 2nd defending their work, the STB now has the final word on whether the application is complete. For railcar owners and lessors, this creates a state of suspended animation. We are looking at a full year—likely stretching into 2027—of strategic uncertainty. Until the STB signals whether this deal is actually viable, the industry will find it difficult to optimize long-term fleet strategies against a potentially reshaped North American landscape.
We are watching Labor Peace Agreement
The Brotherhood of Locomotive Engineers and Trainmen concluded the final chapter of the 2025 freight rail bargaining cycle on December 30 when members ratified a five-year national agreement with overwhelming support—marking the last major union settlement and establishing labor stability across North American freight operations through 2030. The agreement, covering more than 12,000 BLET members at 10 major freight railroads including BNSF, Norfolk Southern, and Canadian National, delivered wage increases of 18.8 percent over the contract term, a $500 lump sum signing payment, improved vacation accrual, and critically, zero concessions or work rule changes.
The 70% ratification by voting members represents decisive support after BLET National President Mark Wallace and the union’s bargaining team conducted extensive cross-country meetings to educate members on settlement terms. Coming as the final of 12 rail unions to reach tentative agreement—the Brotherhood held out longest for optimal positioning—the BLET settlement provided the closing piece to labor peace that had seemed threatened just months earlier. The wage and benefits package establishes predictable labor cost structures for the next five years, while removing a significant source of industry uncertainty as 2026 opens.
For PFL’s customer base and the broader railcar operating ecosystem, the BLET settlement removes what the industry had characterized as a major Q1 2026 risk. As one industry observer noted, “avoiding disruption is often as important as adding capacity” in rail’s constrained operating environment. The 2022 labor crisis, when a handful of congressional hours stood between the nation and an economically catastrophic rail strike, demonstrated how fragile service reliability becomes under labor uncertainty. This contract closes that file through 2030. The absence of work rule changes is particularly significant for operational efficiency—it preserves the current framework for scheduling, productivity, and network management that railroads have grown accustomed to. Benefits begin rolling out over the next 60 days, providing union members with immediate improvements while allowing railroads to budget labor costs with confidence.
However, the agreement should not be confused with comprehensive labor resolution. Underlying challenges remain: hiring, retention, fatigue management, and attendance policies continue to create long-term tension between crew availability and network efficiency. This agreement “buys time, but it doesn’t eliminate the underlying tension” between competing operational imperatives. For Q1 2026 specifically, however, the contract removes the wildcard risk of labor disruption and allows networks to focus on execution rather than managing contract uncertainty. That clarity is valuable as winter operations enter their most operationally complex period.
PFL is Watching Rail Car Manufacturing
As we enter 2026, the North American railcar market is defined by a bizarre split personality. We are seeing exceptional strength in leasing and secondary markets, yet anemic demand for new builds.
On the leasing side, it is a landlord’s market. Operating lessors are reporting renewal rates approximately 25% higher than expiring contracts, with fleet utilization sitting at a near-perfect 98.9%. Tank car rates are a prime example: a full-serve DOT-117 can now command One Thousand One Hundred and Twenty-Five Dollars ($1,125.00) per month.
However, the manufacturing side tells a much darker story:
· Anemic Orders: Third-quarter 2025 orders dropped to just 3,071 units – a 25% decline from an already weak previous quarter.
· Thin Backlogs: The industry backlog has shriveled to 25,687 units. At current delivery rates, that is less than a year’s worth of production visibility.
· The “Replacement” Trap: Forecasters suggest we aren’t in a typical cycle, but rather a “post-COVID normalization” where builds hover around 40,516 units annually – well below historical averages.
Why the disconnect? It’s a perfect storm of uncertainty. High steel and labor costs have pushed new car prices to uncomfortable levels, while persistent tariff concerns make a 30 to 50 year asset feel like a risky bet.
For PFL customers, this is a double-edged sword. While lead times for new equipment have compressed significantly because manufacturing shops are under-utilized, the broader manufacturing slump is a warning light. It suggests the rest of the industry remains deeply skeptical about future freight demand and commodity flows. Please call PFL to discuss further, or to troubleshoot your fleet requirements. We look forward to building a great 2026 together.
We are watching Key Economic Indicators
Industrial Output & Capacity Utilization
Manufacturing accounts for roughly 75% of total industrial output. In November 2025, manufacturing output was flat m/m, following a decline in October, and is +1.9% y/y. Total capacity utilization was 76.0%, up slightly from 75.9% (still about 3.6 pp below its long-run average). Manufacturing capacity utilization was 75.4%, essentially unchanged, still pointing to persistent slack even as headline output shows modest improvement.
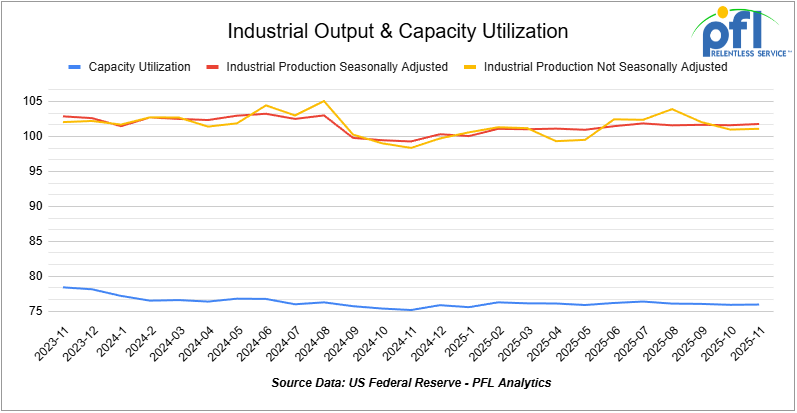
Lease Bids
- 30-50, 6000cf Steel Hopper located off of CSX or NS in East. For use in petcoke service. Period: 5 Years.
- 10, 2500CF Open Top Hopper located off of UP or BN in Texas. For use in aggregate service. Period: 5 years. Need Rapid Discharge Doors.
- 50, 23.5-25.5 DOT111 Tank located off of Any Class 1 in USA. For use in Asphalt service. Period: 5 years.
- 100, 21.9K 117J Tank located off of All Class 1s in Midwest. For use in CO2 service. Period: 6 months.
- 30-50, 30K 117J Tank located off of NS or CSX in Northeast. For use in C5 service. Period: 1 year.
- 30, 30K 117J Tank located off of UP in Harlingen, TX. For use in Ethanol service. Period: 1 Year.
- 60, 33K 340W Tank located off of BNSF in UT/AZ. For use in Propane service. Period: Trip Lease.
Sales Bids
- 28, 3400CF Hopper Covered located off of UP BN in Texas. For use in Cement service.Cement Gates needed.
- 20, 17K Tank DOT111 located off of various class 1s in various locations. For use in corn syrup service.
- 120, Various Gondola Open-Top Aluminum Rotary located off of various class 1s in various locations. For use in Sulphur service.Built 2004 or later.
- 30, 29K Tank DOT111 located off of various class 1s in Chicago. For use in Veg Oil service.
Lease Offers
- 100, 30K CPC1232 Tanks located off of UP or BN in Texas. Last used in Diesel.
- 100, 30K DOT117J Tanks located off of UP or BN in Texas. Last used in Gasoline.
- 100, 29K DOT117J Tanks located off of UP or BN in Texas. Last used in Gasoline. Coiled and Insulated.
- 36, 6351 Covered Hopper located off of CN in Wisconsin. Last used in Grain. through 2/27.
- 29, 6580 Covered Hopper located off of CN in Wisconsin. Last used in Grain. through 2/26.
- 18, 6580 Covered Hopper located off of CN in Wisconsin. Last used in Grain. through 2/27.
- 9, 5400 Covered Hopper located off of CN in Wisconsin. Last used in Grain. through 2/27.
- 21, 6351 Covered Hopper located off of CN in Wisconsin. Last used in DDG. Available until February 2027.
- 29, 6500 Covered Hopper located off of CN in Wisconsin. Last used in DDG. Available until February 2027.
- 50, 5380 Covered Hopper located off of UP or BN in Houston. Last used in Fertilizer. Cars are currently clean. Available until February.
- 50, 20K DOT117J Tank located off of All Class 1s in Moving. Last used in Styrene.
- 29, 25.5K DOT117J Tank located off of UP or BN in Texas. Cars are currently clean. Cars are currently clean.
- 90, 30K DOT117J Tank located off of UP or BN in Corpus Christie. Last used in Diesel.
Sales Offers
- 21, 50′ Boxcar Plate Cs located off of various class 1s in NM. End of Life.
- 3, 50′ Boxcar Plate Cs located off of various class 1s in multiple locations. End of Life.
- 27, 50′ Boxcar Plate Cs located off of various class 1s in PQ. End of Life.
- 100, 3250 Covered Hoppers located off of various class 1s in multiple locations. Sand Cars.
- 5, 2740 Mill Gondolas located off of various class 1s in NC. End of Life.
- 1, 2260 Mill Gondolas located off of various class 1s in AL. End of Life.
- 30, 2740 Mill Gondolas located off of various class 1s in multiple locations. End of Life.
- 21, 2740 Mill Gondolas located off of various class 1s in WA. End of Life.
- 9, 4750 Covered Hoppers located off of various class 1s in multiple locations. End of Life.
- 5, 4750 Covered Hoppers located off of various class 1s in multiple locations. End of Life.
- 50, 31.8K Tank CPC 1232s located off of UP or BN in TX. Requal Due in 2025.
- 100, 4600CF Open Top Hoppers located off of BN or CSX in Southeast. N/A.
Call PFL today to discuss your needs and our availability and market reach. Whether you are looking to lease cars, lease out cars, buy cars, or sell cars call PFL today at 239-390-2885
Live Railcar Markets
| CAT | Type | Capacity | GRL | QTY | LOC | Class | Prev. Use | Offer | Note |
|---|
PFL will be at the Following Conferences
- Where: La Quinta, CA
- Attending: David Cohen (954-729-4774)
- Conference Website
- Where: Hyatt Regency Dallas in Dallas, TX
- Attending:Curtis Chandler (239.405.3365), David Cohen (954-729-4774), Brian Baker (239.297.4519), Cyndi Popov(403) 402-5043
- Conference Website
The post PFL Railcar Report 1-5-2026 appeared first on PFL Petroleum Services LTD.
]]>The post PFL Railcar Report 12-29-2025 appeared first on PFL Petroleum Services LTD.
]]>Jobs Update
- Initial jobless claims seasonally adjusted for the week ending December 24, 2025 came in at 214,000, versus the adjusted number of 224,000 people from the week prior, down 10,000 people week-over-week.
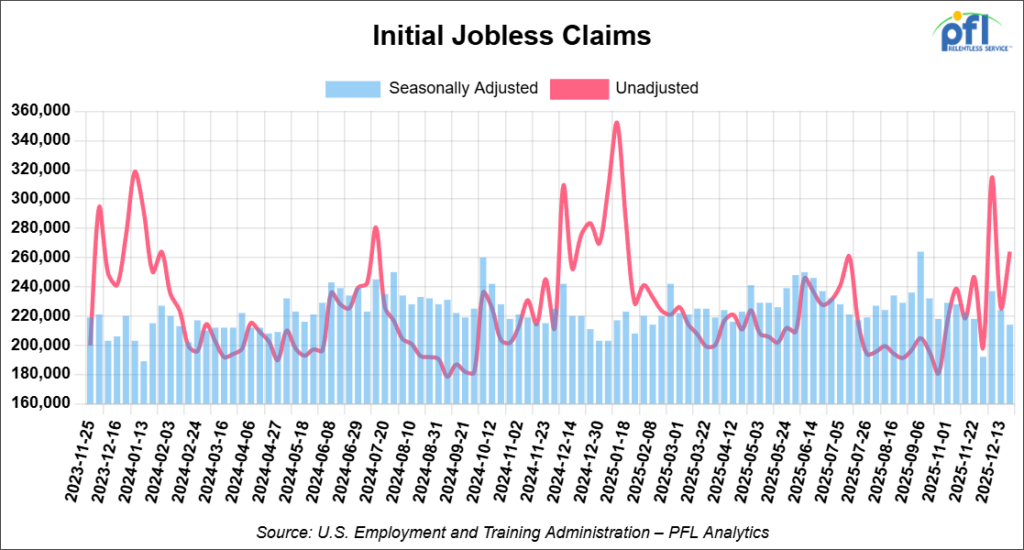
- Continuing jobless claims came in at 1,923,000, versus the adjusted number of 1,885,000 people from the week prior, up 38,000 week-over-week.
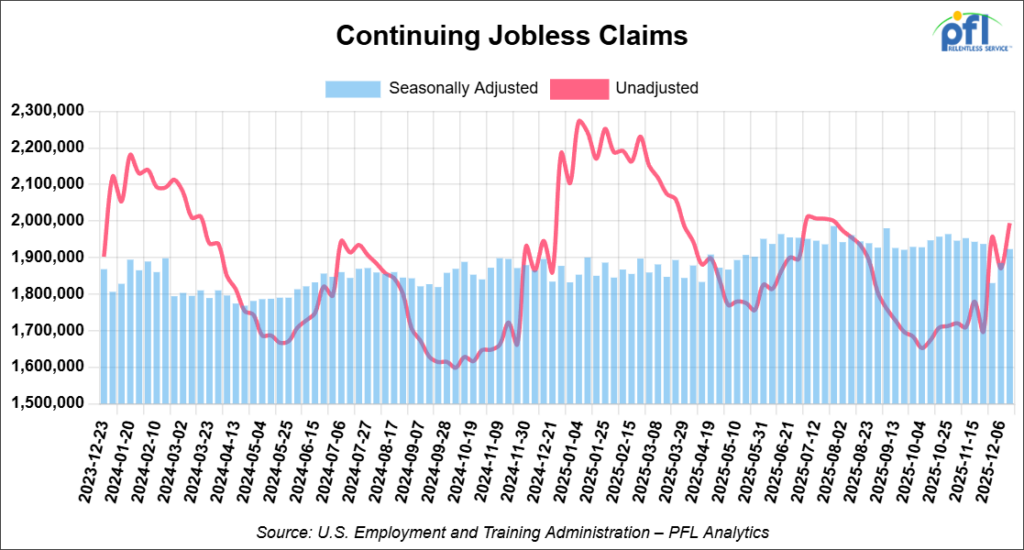
Stocks closed lower on Friday of last week, but higher week-over-week
The DOW closed lower on Friday of last week, down -20.19 points (-0.04%), closing out the week at 48,710.97, up 576.39 points week-over-week. The S&P 500 closed lower on Friday of last week, down -2.11 points (-0.03%), and closed out the week at 6,929.94, up 95.23 points week-over-week. The NASDAQ closed lower on Friday of last week, down -20.21 points (-0.09%), and closed out the week at 23,593.10, up 285.48 points week-over-week.
In overnight trading, DOW futures traded lower and are expected to open at 48,995 this morning, down -3 points from Friday’s close.
Crude oil closed lower on Friday of last week, but higher week-over-week
West Texas Intermediate (WTI) crude closed down -1.61 per barrel (-2.8%), to close at $56.74 on Friday of last week, but up 8 cents week-over-week. Brent crude closed down -1.60 per barrel (-2.6%), to close at $60.64, but up 17 cents week-over-week.
One Exchange WCS (Western Canadian Select) for February delivery settled on Wednesday of last week at US$13.50 (markets were closed Thursday and Friday for Christmas and Boxing Day in Canada last week) below the WTI-CMA (West Texas Intermediate – Calendar Month Average). The implied value with WTI closing at $56.74 on Friday of last week would put WSC at US$43.24 per barrel.
Please Note Closing Stocks are for the week ending December 12, 2025 – Next EPA Data Release is 12/31
U.S. commercial crude oil inventories (excluding those in the Strategic Petroleum Reserve) decreased by 1.3 million barrels week-over-week. At 424.4 million barrels, U.S. crude oil inventories are 4% below the five-year average for this time of year.

Total motor gasoline inventories increased by 4.8 million barrels week-over-week and are slightly below the five-year average for this time of year.

Distillate fuel inventories increased by 1.7 million barrels week-over-week and are 6% below the five-year average for this time of year.
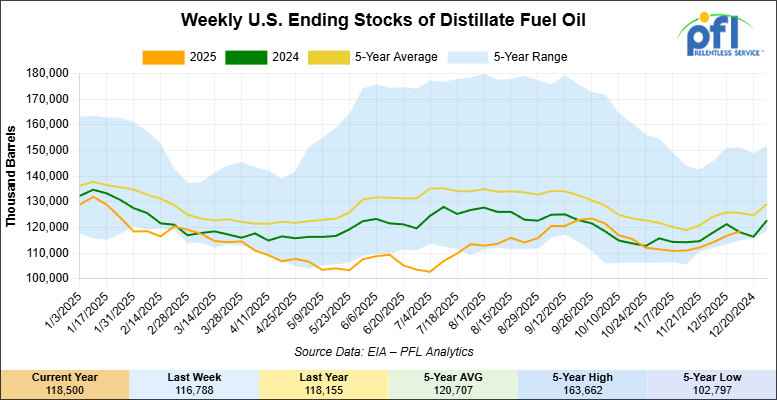
Propane/propylene inventories decreased 1.8 million barrels week-over-week and are 17% above the five-year average for this time of year.

Propane prices closed at 66.9 cents per gallon on Friday of last week, down 1 cent per gallon week-over-week, and down 9.9 cents per gallon year-over-year.
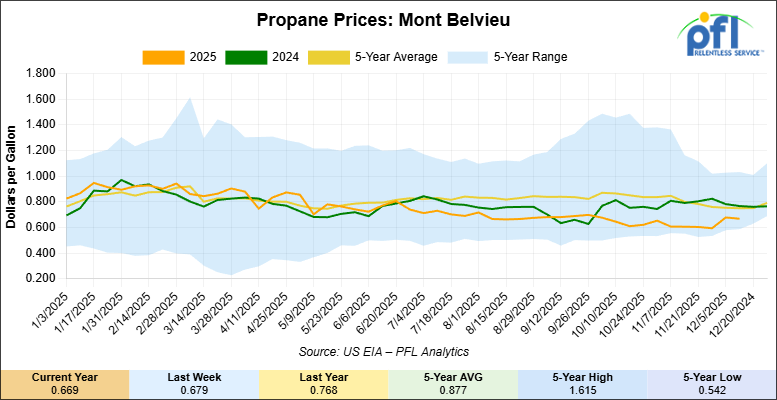
Overall, total commercial petroleum inventories increased by 2.1 million barrels week-over-week during the week ending December 12, 2025.
U.S. crude oil imports averaged 6.5 million barrels per day during the week ending December 12, 2025, a decrease of 64,000 barrels per day week-over-week. Over the past four weeks, crude oil imports averaged 6.4 million barrels per day, 1.8% less than the same four-week period last year. Total motor gasoline imports (including both finished gasoline and gasoline blending components) averaged 834,000 barrels per day, and distillate fuel imports averaged 268,000 barrels per day during the week ending December 12, 2025.
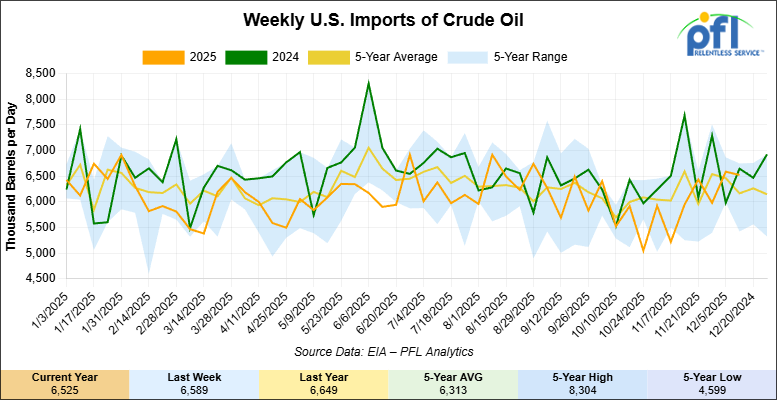
U.S. crude oil exports averaged 4.664 million barrels per day during the week ending December 12, 2025, an increase of 655,000 barrels per day week-over-week. Over the past four weeks, crude oil exports averaged 3.971 million barrels per day.
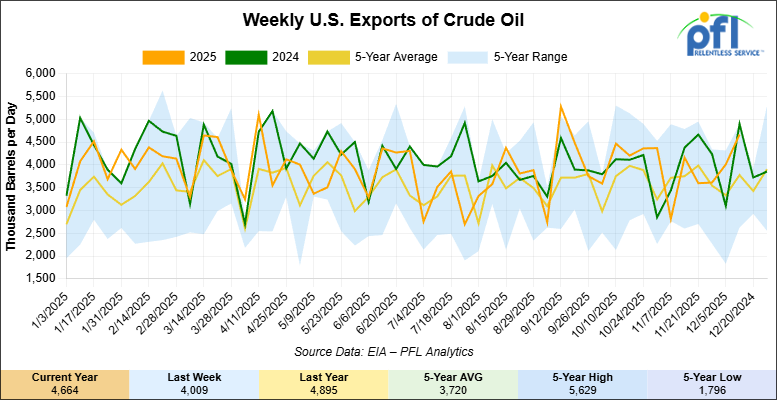
U.S. crude oil refinery inputs averaged 17 million barrels per day during the week ending December 12, 2025, which was 129,000 barrels per day more week-over-week.
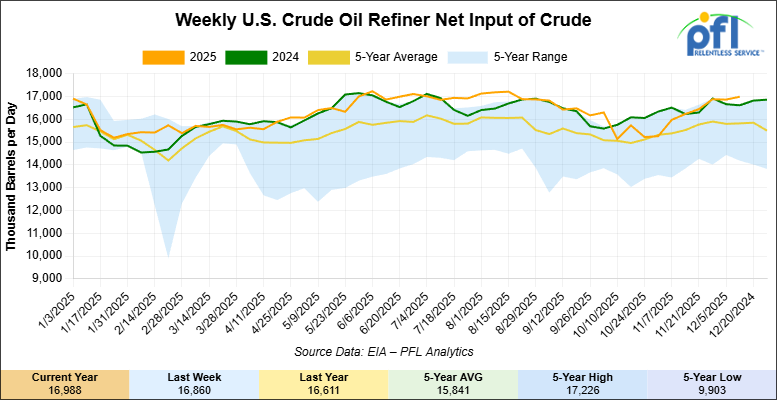
WTI futures are poised to open at $57.97, up $1.23 from Friday’s close.
North American Rail Traffic
Week Ending December 17, 2025:
Total North American weekly rail volumes were down (-2.93%) in week 51, compared with the same week last year. Total Carloads for the week ending December 17, 2025 were 318,120, down (-2.73%) compared with the same week in 2024, while weekly Intermodal volume was 356,352, down (-3.10%) year over year. 9 of the AAR’s 11 major traffic categories posted year-over-year decreases. The largest decrease came from Forest Products (-19.12%), while the largest increase was Coal (+9.63%).
In the East, CSX’s total volumes were up (+1.76%), with the largest decrease coming from Metallic Ores and Metals (-17.47%), while the largest increase came from Intermodal Units (+8.04%). NS’s total volumes were down (-0.19%), with the largest increase coming from Petroleum & Petroleum Products (+25.32%), while the largest decrease came from Grain (-26.65%).
In the West, BNSF’s total volumes were down (-2.47%), with the largest increase coming from Other (+9.65%), while the largest decrease came from Metallic Ores and Metals (-24.33%). UP’s total volumes were down (-4.52%), with the largest increase coming from Coal (+22.13%), while the largest decrease came from Grain (-20.06%).
In Canada, CN’s total volumes were down (-4.34%), with the largest increase coming from Other (+134.27%), while the largest decrease came from Chemicals (-16.71%). CPKC’s total volumes were down (-22.63%), with the largest increase coming from Coal (+14.06%), while the largest decrease came from Forest Products (-65.33%).
Source Data: AAR – PFL Analytics
North American Rig Count Summary
Rig Count
North American rig count was down by -64 rigs week-over-week. The US rig count was up by +3 rigs week-over-week, and down by -44 rigs year-over-year. The US currently has 545 active rigs. Canada’s rig count was down by -67 rigs week-over-week and up by +23 rigs year-over-year. Canada currently has 118 active rigs. Overall, year-over-year we are down by -21 rigs collectively.
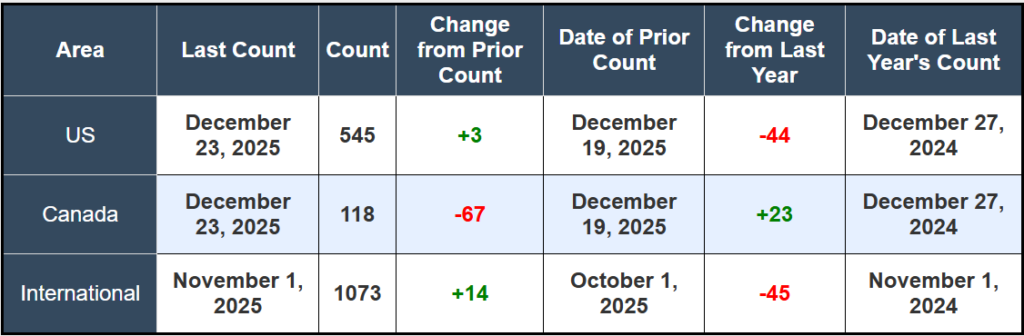
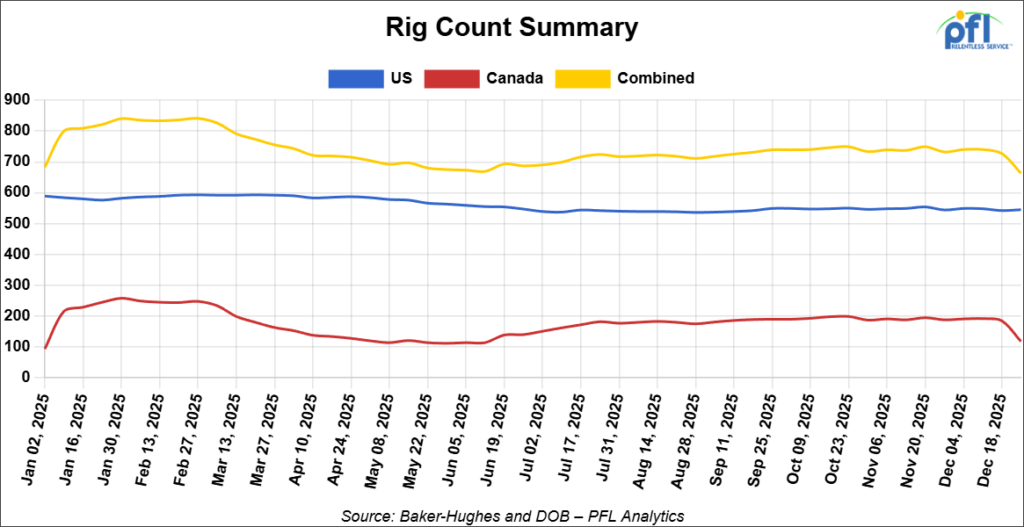
We are watching a few things out there for you:
PFL was watching the CSX and the CPKC’s Holiday Trains
We hope that everyone had a fantastic Christmas!
As the year winds down, rail talk quickly turned to inventories, storage, and what Q1 might bring. Before that reset fully sets in, two long-running holiday train programs wrapped up their 2025 runs, a reminder that rail has always been about more than freight.
Different in scale and style, both programs put a human face on the network and the communities railroads continue to serve.
Canadian Pacific Kansas City Holiday Train
The CPKC Holiday Train finished its late-December run across the U.S. and Canada, closing out another multi-week tour through Midwest towns and major rail hubs. Since launching in 1999, the program has become a familiar year-end moment in many communities, one that blends rail visibility with local giving.

Source: CKPC – PFL Analytics
2025 Holiday Train – by the numbers
- Raised over $2 million for food banks
- Collected more than 175,000 pounds of food
- Made stops across dozens of U.S. and Canadian communities
Across the upper midwest, people line the tracks, kids climb onto shoulders, donations are handed over, concerts are enjoyed by stage car, and for a few minutes rail becomes something personal rather than something that simply passes through town. Behind the scenes, it’s also a reminder of what rail workers know well: getting anything done reliably in December still takes planning, coordination, and a lot of people showing up in tough winter conditions.
CSX Transportation Santa Train
Further east, CSX marked another season of a very different tradition. The CSX Santa Train, now more than 80 years old, once again ran through Appalachia, serving communities along a defined corridor in Kentucky, southwest Virginia, and Tennessee.
2025 Santa Train – by the numbers
- Covered a 110-mile route
- Distributed more than 15 tons of gifts
- Reached dozens of Appalachian communities along the line
There’s no stage car or concert involved here. The Santa Train is about continuity. Employees, volunteers, and partners return to the same towns year after year, many with deep, multi-generation ties to the railroad. For many communities, the Santa Train isn’t a special event, it’s simply part of the season.
Source: Echoes of Appalachia – PFL Analytics
We are Watching the STB
The Surface Transportation Board’s first procedural move following the December 19th merger of the NS and UP filing sets the tone for months ahead. The STB has established the deadline for public comments on whether the 7,000-page application is complete for December 29thtoday. This initial step is critical; if the STB finds gaps or insufficient detail, it can pause the statutory review clock until applicants provide additional information.
Industry stakeholders have been mobilizing. The American Chemistry Council (ACC) issued a statement warning that the deal could create a “coast-to-coast monopoly”, while Canadian rivals CPKC and CN warned of “extraordinary risks” to network competition. The merger has support from over 2,000 stakeholders, including the SMART-TD union and President Trump.
We are watching Canadian Crude by Rail
Crude by rail out of Canada decreased month-over-month. The Canadian Energy regulator reported on December 24, that 78,117 barrels were exported per day during the month of October 2025, down from 86,711 barrels in September of 2025, a decrease of -8,594 barrels per day and its second straight month over-month decline.
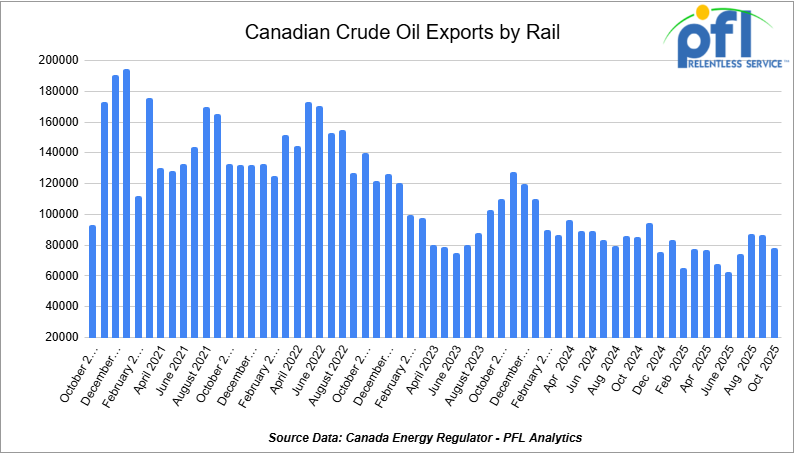
Crude by rail will always be necessary out of Canada for stranded oil not connected by pipelines. Raw bitumen, which is shipped as a non-haz product and is not able to flow in pipelines, is competitive with pipeline tolls and is a growing market to keep an eye on, particularly in light of Strathcona and Gibson announcing new projects. Other factors would be existing long-term contractual commitments and basis – we really need to see basis WTI-CMA (West Texas Intermediate – Calendar Month Average) blowout to -18 per barrel for sustained periods of time to make economic sense. Current rail rates from Alberta to the U.S. Gulf Coast have averaged $15.36 per barrel, making rail competitive whenever WCS-WTI spreads exceed $18 per barrel, including quality adjustments.
We are Watching Enbridge’s Line 5
A federal district judge ruled last week that the U.S. Pipeline Safety Act pre-empts Michigan’s attempts to shut down Enbridge’s Line 5 pipeline. This decision secures the continued flow of 540,000 barrels per day of light crude and NGLs to Sarnia and Midwest refineries. For tank car markets, the ruling prevents what would have been a chaotic scramble for rail capacity. Industry analysis indicates rail could only absorb roughly 50,000 bpd of displaced volume—less than 10% of the pipeline’s throughput—leaving a massive shortfall that would have crippled refinery operations.
The next legal front shifts to Wisconsin, where the Bad River Band is suing the Army Corps of Engineers over permits for the Line 5 reroute.
We are Watching Canadian Grain
Western Canadian grain shipments posted a strong finish to the 2024–25 crop year, with railways moving 49 million tonnes – a 12.1% increase compared to the prior year’s 43.7 million tonnes. This surge is significant for hopper car demand, indicating sustained appetite for covered hoppers across both CN and CPKC fleets.
Looking ahead, both major railways have released their 2025–26 grain transportation plans. CN is prepared to move between 27–29.5 million tonnes during the upcoming crop year, down from its record 31 million tonnes in 2024–25, but still robust. CPKC has committed to supplying capacity for up to 34 million tonnes of Canadian grain and grain products, subject to market demand, with weekly capacity targets of 685,000 tonnes during open navigation season at Thunder Bay and 525,000 tonnes during winter months.
The Canadian Transportation Agency (CTA) also issued its year-end determination on December 19th: CPKC exceeded its maximum grain revenue entitlement for 2024–25 by $2.66 million, requiring payment to the Western Grains Research Foundation. CN came in approximately $5.9 million below its entitlement. The robust volume growth—despite CPKC’s revenue ceiling breach—underscores the continued strength of Canadian grain exports and the steady demand for rail equipment in this sector.
We are watching the Pacific North West
Rail operations stabilized this week following earlier disruptions in the Pacific Northwest. BNSF reported that the “persistent weather pattern” bringing historic rainfall and flooding to the region has largely abated, with most subdivisions back in service. However, shipments moving between December 24 and January 3 may experience delays of 24 – 48 hours due to lighter train starts and reduced connecting carrier activity during the holiday period.
We are Watching “Air Cars” Help Capacity
While broader markets focus on headline velocity metrics, the real capacity battle this winter is being fought with air pressure. CN has strategically deployed its fleet of specialized distributed air braking cars—modified boxcars equipped with high-capacity air compressors—across Prairie corridors as temperatures approach the critical -25°C threshold that triggers operational restrictions.
This technology solves the single biggest capacity killer in extreme cold: brake line pressure loss. When temperatures plunge, rubber gaskets stiffen and metal couplings contract, causing air leakage that makes it impossible to maintain safe braking pressure at the tail end of a standard 10,000-foot train. Without these air cars, railroads are forced by physics and regulation to slash train lengths by up to 30% to maintain safety margins.
CN invested over $1 million to overhaul 20 of its distributed air braking cars in 2024, replacing air compressors and other major components specifically for this winter season. The railway operates a total fleet of approximately 100 such units, which it deploys strategically during the coldest months to reduce the need to shorten trains.
For shippers, the deployment of these units is a quiet bullish signal. An air car positioned mid-train acts as a mobile compressor station, allowing the railroad to run full-length consists even in a deep freeze. Every long train that successfully departs Winnipeg or Edmonton this week represents “ghost capacity”—tonnage that moved without requiring an extra crew start or additional locomotive. By keeping train lengths intact, CN protects its crew base from exhaustion and maintains asset velocity when other carriers might be cutting consists.
If CN’s winter service holds up better than expected in January, this specific hardware deployment will likely be a contributing factor. PFL will continue to monitor distributed air car utilization as a leading indicator of network capacity resilience.
We are watching Economic Indicators
Consumer Confidence
The Index of Consumer Sentiment from the University of Michigan decreased from 92.9 in November to 89.1 in December.
The Conference Board Consumer Confidence Index increased from 51 in November to 53.3 in December.
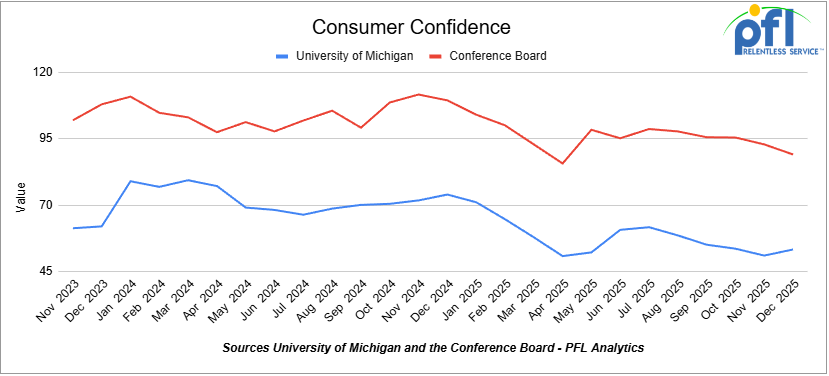
Lease Bids
- 30-50, 6000cf Steel Hopper located off of CSX or NS in East. For use in petcoke service. Period: 5 Years.
- 10, 2500CF Open Top Hopper located off of UP or BN in Texas. For use in aggregate service. Period: 5 years. Need Rapid Discharge Doors.
- 50, 23.5-25.5 DOT111 Tank located off of Any Class 1 in USA. For use in Asphalt service. Period: 5 years.
- 100, 21.9K 117J Tank located off of All Class 1s in Midwest. For use in CO2 service. Period: 6 months.
- 30-50, 30K 117J Tank located off of NS or CSX in Northeast. For use in C5 service. Period: 1 year.
Sales Bids
- 28, 3400CF Hopper Covered located off of UP BN in Texas. For use in Cement service.Cement Gates needed.
- 20, 17K Tank DOT111 located off of various class 1s in various locations. For use in corn syrup service.
- 120, Various Gondola Open-Top Aluminum Rotary located off of various class 1s in various locations. For use in Sulphur service.Built 2004 or later.
- 30, 29K Tank DOT111 located off of various class 1s in Chicago. For use in Veg Oil service.
Lease Offers
- 100, 30K CPC1232 Tanks located off of UP or BN in Texas. Last used in Diesel.
- 100, 30K DOT117J Tanks located off of UP or BN in Texas. Last used in Gasoline.
- 100, 29K DOT117J Tanks located off of UP or BN in Texas. Last used in Gasoline. Coiled and Insulated.
- 36, 6351 Covered Hopper located off of CN in Wisconsin. Last used in Grain. through 2/27.
- 29, 6580 Covered Hopper located off of CN in Wisconsin. Last used in Grain. through 2/26.
- 18, 6580 Covered Hopper located off of CN in Wisconsin. Last used in Grain. through 2/27.
- 9, 5400 Covered Hopper located off of CN in Wisconsin. Last used in Grain. through 2/27.
- 21, 6351 Covered Hopper located off of CN in Wisconsin. Last used in DDG. Available until February 2027.
- 29, 6500 Covered Hopper located off of CN in Wisconsin. Last used in DDG. Available until February 2027.
- 50, 5380 Covered Hopper located off of UP or BN in Houston. Last used in Fertilizer. Cars are currently clean. Available until February.
- 50, 20K DOT117J Tank located off of All Class 1s in Moving. Last used in Styrene.
- 29, 25.5K DOT117J Tank located off of UP or BN in Texas. Cars are currently clean. Cars are currently clean.
- 90, 30K DOT117J Tank located off of UP or BN in Corpus Christie. Last used in Diesel.
Sales Offers
- 21, 50′ Boxcar Plate Cs located off of various class 1s in NM. End of Life.
- 3, 50′ Boxcar Plate Cs located off of various class 1s in multiple locations. End of Life.
- 27, 50′ Boxcar Plate Cs located off of various class 1s in PQ. End of Life.
- 100, 3250 Covered Hoppers located off of various class 1s in multiple locations. Sand Cars.
- 5, 2740 Mill Gondolas located off of various class 1s in NC. End of Life.
- 1, 2260 Mill Gondolas located off of various class 1s in AL. End of Life.
- 30, 2740 Mill Gondolas located off of various class 1s in multiple locations. End of Life.
- 21, 2740 Mill Gondolas located off of various class 1s in WA. End of Life.
- 9, 4750 Covered Hoppers located off of various class 1s in multiple locations. End of Life.
- 5, 4750 Covered Hoppers located off of various class 1s in multiple locations. End of Life.
- 50, 31.8K Tank CPC 1232s located off of UP or BN in TX. Requal Due in 2025.
- 100, 4600CF Open Top Hoppers located off of BN or CSX in Southeast. N/A.
Call PFL today to discuss your needs and our availability and market reach. Whether you are looking to lease cars, lease out cars, buy cars, or sell cars call PFL today at 239-390-2885
Live Railcar Markets
| CAT | Type | Capacity | GRL | QTY | LOC | Class | Prev. Use | Offer | Note |
|---|
PFL will be at the Following Conferences
- Where: La Quinta, CA
- Attending: David Cohen (954-729-4774)
- Conference Website
- Where: Hyatt Regency Dallas in Dallas, TX
- Attending:Curtis Chandler (239.405.3365), David Cohen (954-729-4774), Brian Baker (239.297.4519), Cyndi Popov(403) 402-5043
- Conference Website
The post PFL Railcar Report 12-29-2025 appeared first on PFL Petroleum Services LTD.
]]>